Welsh vs Tlingit-Haida Disability Age Over 75
COMPARE
Welsh
Tlingit-Haida
Disability Age Over 75
Disability Age Over 75 Comparison
Welsh
Tlingit-Haida
47.0%
DISABILITY AGE OVER 75
81.3/ 100
METRIC RATING
149th/ 347
METRIC RANK
50.6%
DISABILITY AGE OVER 75
0.0/ 100
METRIC RATING
310th/ 347
METRIC RANK
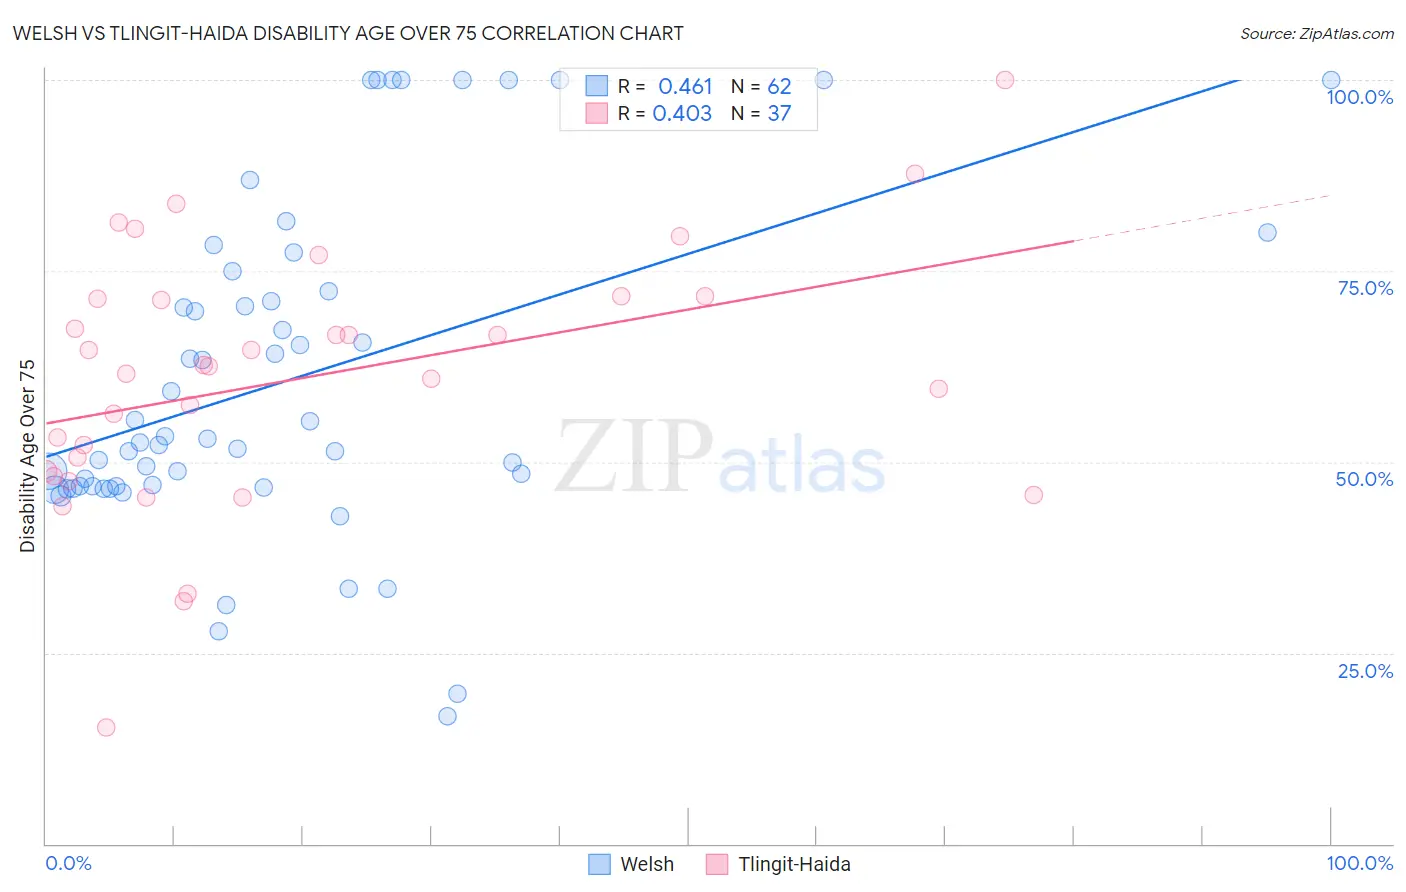
Welsh vs Tlingit-Haida Disability Age Over 75 Correlation Chart
The statistical analysis conducted on geographies consisting of 527,126,487 people shows a moderate positive correlation between the proportion of Welsh and percentage of population with a disability over the age of 75 in the United States with a correlation coefficient (R) of 0.461 and weighted average of 47.0%. Similarly, the statistical analysis conducted on geographies consisting of 60,768,842 people shows a moderate positive correlation between the proportion of Tlingit-Haida and percentage of population with a disability over the age of 75 in the United States with a correlation coefficient (R) of 0.403 and weighted average of 50.6%, a difference of 7.8%.
Disability Age Over 75 Correlation Summary
| Measurement | Welsh | Tlingit-Haida |
| Minimum | 16.7% | 15.2% |
| Maximum | 100.0% | 100.0% |
| Range | 83.3% | 84.8% |
| Mean | 60.7% | 60.9% |
| Median | 52.8% | 62.5% |
| Interquartile 25% (IQ1) | 46.8% | 48.4% |
| Interquartile 75% (IQ3) | 72.3% | 71.5% |
| Interquartile Range (IQR) | 25.5% | 23.0% |
| Standard Deviation (Sample) | 21.5% | 16.9% |
| Standard Deviation (Population) | 21.3% | 16.7% |
Similar Demographics by Disability Age Over 75
Demographics Similar to Welsh by Disability Age Over 75
In terms of disability age over 75, the demographic groups most similar to Welsh are Asian (46.9%, a difference of 0.010%), Immigrants from Russia (47.0%, a difference of 0.070%), French Canadian (47.0%, a difference of 0.080%), Immigrants from Peru (46.9%, a difference of 0.11%), and Guyanese (46.9%, a difference of 0.12%).
| Demographics | Rating | Rank | Disability Age Over 75 |
| Peruvians | 86.5 /100 | #142 | Excellent 46.8% |
| Bermudans | 85.6 /100 | #143 | Excellent 46.9% |
| Venezuelans | 85.0 /100 | #144 | Excellent 46.9% |
| Costa Ricans | 84.5 /100 | #145 | Excellent 46.9% |
| Guyanese | 84.3 /100 | #146 | Excellent 46.9% |
| Immigrants | Peru | 84.1 /100 | #147 | Excellent 46.9% |
| Asians | 81.6 /100 | #148 | Excellent 46.9% |
| Welsh | 81.3 /100 | #149 | Excellent 47.0% |
| Immigrants | Russia | 79.3 /100 | #150 | Good 47.0% |
| French Canadians | 79.0 /100 | #151 | Good 47.0% |
| Immigrants | Asia | 76.5 /100 | #152 | Good 47.0% |
| Immigrants | Zaire | 74.8 /100 | #153 | Good 47.1% |
| Immigrants | Belarus | 74.8 /100 | #154 | Good 47.1% |
| Immigrants | Iran | 74.7 /100 | #155 | Good 47.1% |
| Arabs | 73.3 /100 | #156 | Good 47.1% |
Demographics Similar to Tlingit-Haida by Disability Age Over 75
In terms of disability age over 75, the demographic groups most similar to Tlingit-Haida are Hispanic or Latino (50.6%, a difference of 0.040%), Aleut (50.6%, a difference of 0.040%), Immigrants from Fiji (50.6%, a difference of 0.070%), Cajun (50.7%, a difference of 0.10%), and Immigrants from Central America (50.5%, a difference of 0.12%).
| Demographics | Rating | Rank | Disability Age Over 75 |
| Japanese | 0.0 /100 | #303 | Tragic 50.2% |
| Immigrants | Dominican Republic | 0.0 /100 | #304 | Tragic 50.3% |
| Central American Indians | 0.0 /100 | #305 | Tragic 50.5% |
| Immigrants | Central America | 0.0 /100 | #306 | Tragic 50.5% |
| Immigrants | Fiji | 0.0 /100 | #307 | Tragic 50.6% |
| Hispanics or Latinos | 0.0 /100 | #308 | Tragic 50.6% |
| Aleuts | 0.0 /100 | #309 | Tragic 50.6% |
| Tlingit-Haida | 0.0 /100 | #310 | Tragic 50.6% |
| Cajuns | 0.0 /100 | #311 | Tragic 50.7% |
| Cheyenne | 0.0 /100 | #312 | Tragic 50.9% |
| Immigrants | Azores | 0.0 /100 | #313 | Tragic 50.9% |
| Immigrants | Mexico | 0.0 /100 | #314 | Tragic 51.1% |
| Mexicans | 0.0 /100 | #315 | Tragic 51.1% |
| Chickasaw | 0.0 /100 | #316 | Tragic 51.2% |
| Yakama | 0.0 /100 | #317 | Tragic 51.3% |