Welsh vs Immigrants from Serbia Disability Age Over 75
COMPARE
Welsh
Immigrants from Serbia
Disability Age Over 75
Disability Age Over 75 Comparison
Welsh
Immigrants from Serbia
47.0%
DISABILITY AGE OVER 75
81.3/ 100
METRIC RATING
149th/ 347
METRIC RANK
45.3%
DISABILITY AGE OVER 75
100.0/ 100
METRIC RATING
20th/ 347
METRIC RANK
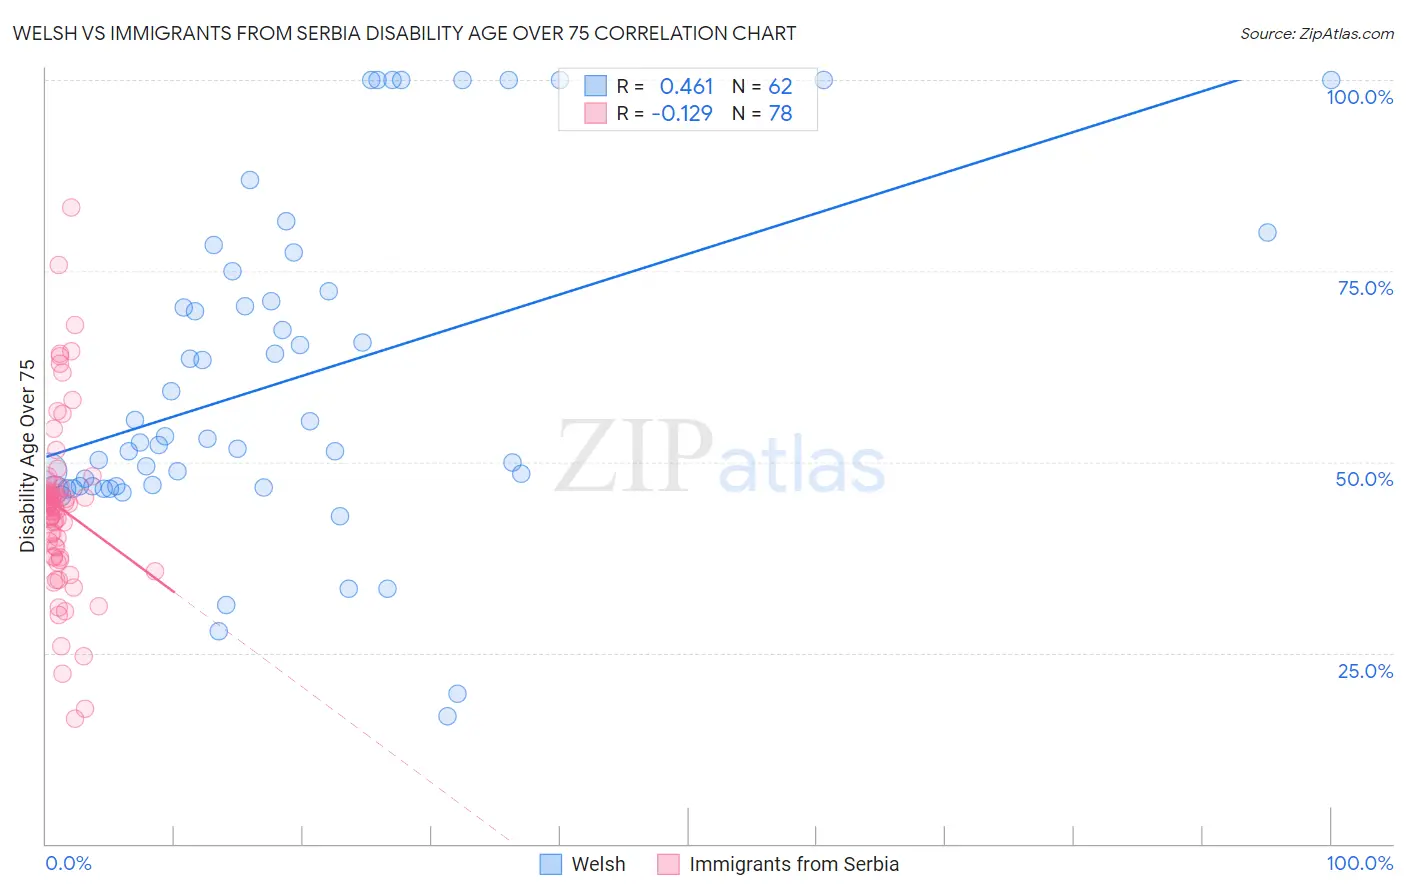
Welsh vs Immigrants from Serbia Disability Age Over 75 Correlation Chart
The statistical analysis conducted on geographies consisting of 527,126,487 people shows a moderate positive correlation between the proportion of Welsh and percentage of population with a disability over the age of 75 in the United States with a correlation coefficient (R) of 0.461 and weighted average of 47.0%. Similarly, the statistical analysis conducted on geographies consisting of 131,709,853 people shows a poor negative correlation between the proportion of Immigrants from Serbia and percentage of population with a disability over the age of 75 in the United States with a correlation coefficient (R) of -0.129 and weighted average of 45.3%, a difference of 3.7%.
Disability Age Over 75 Correlation Summary
| Measurement | Welsh | Immigrants from Serbia |
| Minimum | 16.7% | 16.3% |
| Maximum | 100.0% | 83.3% |
| Range | 83.3% | 67.0% |
| Mean | 60.7% | 44.0% |
| Median | 52.8% | 44.2% |
| Interquartile 25% (IQ1) | 46.8% | 37.6% |
| Interquartile 75% (IQ3) | 72.3% | 46.2% |
| Interquartile Range (IQR) | 25.5% | 8.6% |
| Standard Deviation (Sample) | 21.5% | 11.4% |
| Standard Deviation (Population) | 21.3% | 11.4% |
Similar Demographics by Disability Age Over 75
Demographics Similar to Welsh by Disability Age Over 75
In terms of disability age over 75, the demographic groups most similar to Welsh are Asian (46.9%, a difference of 0.010%), Immigrants from Russia (47.0%, a difference of 0.070%), French Canadian (47.0%, a difference of 0.080%), Immigrants from Peru (46.9%, a difference of 0.11%), and Guyanese (46.9%, a difference of 0.12%).
| Demographics | Rating | Rank | Disability Age Over 75 |
| Peruvians | 86.5 /100 | #142 | Excellent 46.8% |
| Bermudans | 85.6 /100 | #143 | Excellent 46.9% |
| Venezuelans | 85.0 /100 | #144 | Excellent 46.9% |
| Costa Ricans | 84.5 /100 | #145 | Excellent 46.9% |
| Guyanese | 84.3 /100 | #146 | Excellent 46.9% |
| Immigrants | Peru | 84.1 /100 | #147 | Excellent 46.9% |
| Asians | 81.6 /100 | #148 | Excellent 46.9% |
| Welsh | 81.3 /100 | #149 | Excellent 47.0% |
| Immigrants | Russia | 79.3 /100 | #150 | Good 47.0% |
| French Canadians | 79.0 /100 | #151 | Good 47.0% |
| Immigrants | Asia | 76.5 /100 | #152 | Good 47.0% |
| Immigrants | Zaire | 74.8 /100 | #153 | Good 47.1% |
| Immigrants | Belarus | 74.8 /100 | #154 | Good 47.1% |
| Immigrants | Iran | 74.7 /100 | #155 | Good 47.1% |
| Arabs | 73.3 /100 | #156 | Good 47.1% |
Demographics Similar to Immigrants from Serbia by Disability Age Over 75
In terms of disability age over 75, the demographic groups most similar to Immigrants from Serbia are Bolivian (45.2%, a difference of 0.11%), Immigrants from Greece (45.2%, a difference of 0.11%), Immigrants from Belgium (45.3%, a difference of 0.13%), Immigrants from India (45.2%, a difference of 0.14%), and Immigrants from Northern Europe (45.2%, a difference of 0.15%).
| Demographics | Rating | Rank | Disability Age Over 75 |
| Latvians | 100.0 /100 | #13 | Exceptional 45.1% |
| Immigrants | Scotland | 100.0 /100 | #14 | Exceptional 45.1% |
| Immigrants | Sweden | 100.0 /100 | #15 | Exceptional 45.1% |
| Immigrants | Northern Europe | 100.0 /100 | #16 | Exceptional 45.2% |
| Immigrants | India | 100.0 /100 | #17 | Exceptional 45.2% |
| Bolivians | 100.0 /100 | #18 | Exceptional 45.2% |
| Immigrants | Greece | 100.0 /100 | #19 | Exceptional 45.2% |
| Immigrants | Serbia | 100.0 /100 | #20 | Exceptional 45.3% |
| Immigrants | Belgium | 100.0 /100 | #21 | Exceptional 45.3% |
| Immigrants | South Africa | 100.0 /100 | #22 | Exceptional 45.3% |
| Immigrants | Switzerland | 99.9 /100 | #23 | Exceptional 45.3% |
| Poles | 99.9 /100 | #24 | Exceptional 45.3% |
| Immigrants | Bolivia | 99.9 /100 | #25 | Exceptional 45.4% |
| Macedonians | 99.9 /100 | #26 | Exceptional 45.4% |
| Immigrants | Poland | 99.9 /100 | #27 | Exceptional 45.4% |