Welsh vs Tlingit-Haida In Labor Force | Age 30-34
COMPARE
Welsh
Tlingit-Haida
In Labor Force | Age 30-34
In Labor Force | Age 30-34 Comparison
Welsh
Tlingit-Haida
84.2%
IN LABOR FORCE | AGE 30-34
2.7/ 100
METRIC RATING
229th/ 347
METRIC RANK
82.3%
IN LABOR FORCE | AGE 30-34
0.0/ 100
METRIC RATING
304th/ 347
METRIC RANK
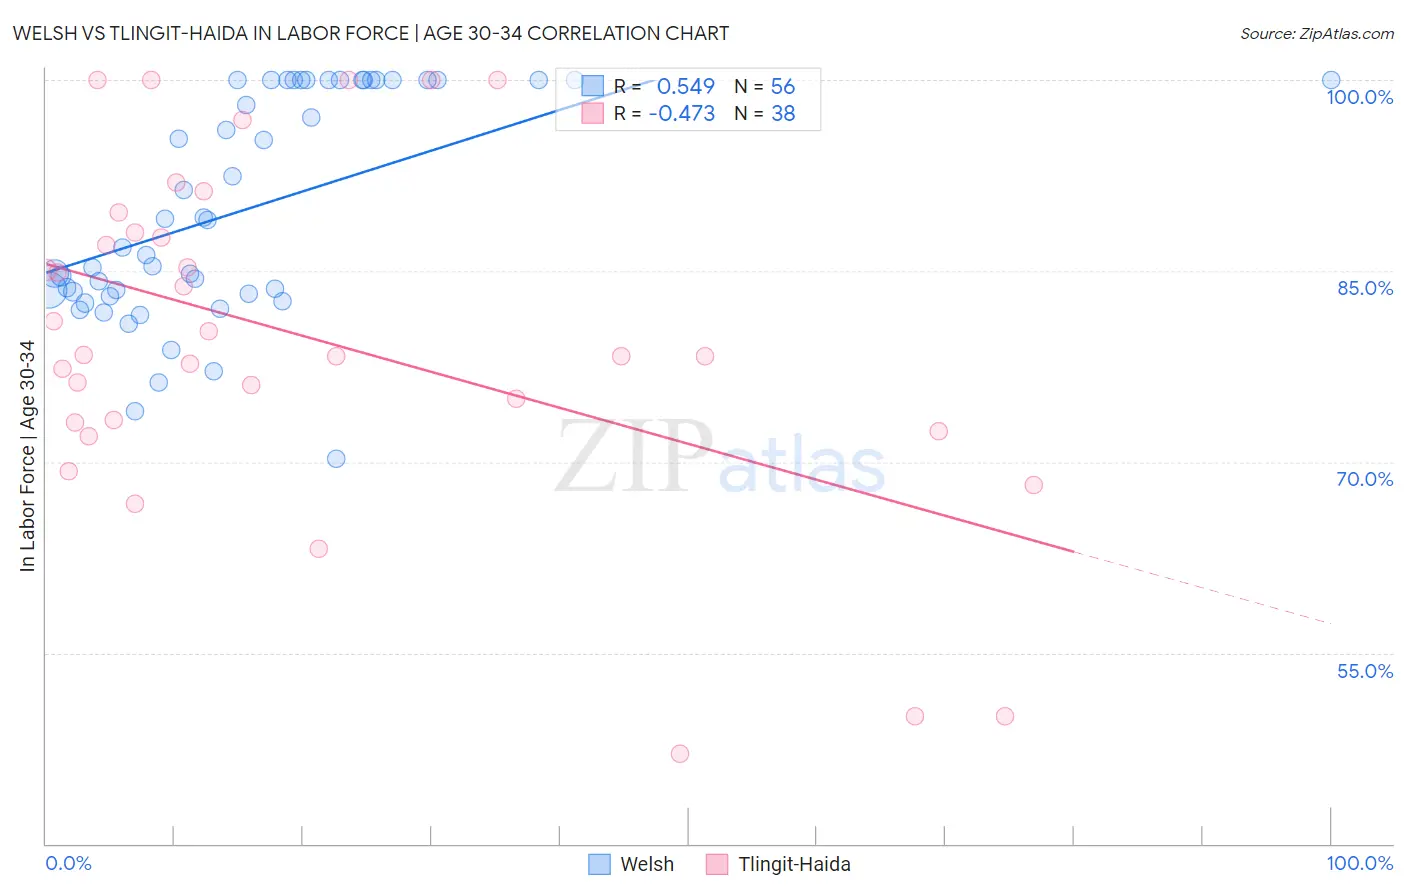
Welsh vs Tlingit-Haida In Labor Force | Age 30-34 Correlation Chart
The statistical analysis conducted on geographies consisting of 527,874,569 people shows a substantial positive correlation between the proportion of Welsh and labor force participation rate among population between the ages 30 and 34 in the United States with a correlation coefficient (R) of 0.549 and weighted average of 84.2%. Similarly, the statistical analysis conducted on geographies consisting of 60,864,119 people shows a moderate negative correlation between the proportion of Tlingit-Haida and labor force participation rate among population between the ages 30 and 34 in the United States with a correlation coefficient (R) of -0.473 and weighted average of 82.3%, a difference of 2.2%.
In Labor Force | Age 30-34 Correlation Summary
| Measurement | Welsh | Tlingit-Haida |
| Minimum | 70.3% | 47.1% |
| Maximum | 100.0% | 100.0% |
| Range | 29.7% | 52.9% |
| Mean | 89.9% | 79.8% |
| Median | 87.9% | 78.3% |
| Interquartile 25% (IQ1) | 83.3% | 73.1% |
| Interquartile 75% (IQ3) | 100.0% | 88.0% |
| Interquartile Range (IQR) | 16.7% | 14.9% |
| Standard Deviation (Sample) | 8.7% | 13.6% |
| Standard Deviation (Population) | 8.6% | 13.4% |
Similar Demographics by In Labor Force | Age 30-34
Demographics Similar to Welsh by In Labor Force | Age 30-34
In terms of in labor force | age 30-34, the demographic groups most similar to Welsh are Immigrants from Cuba (84.2%, a difference of 0.010%), Immigrants from Haiti (84.2%, a difference of 0.010%), Immigrants from Bahamas (84.1%, a difference of 0.010%), Scottish (84.2%, a difference of 0.020%), and Immigrants from El Salvador (84.2%, a difference of 0.020%).
| Demographics | Rating | Rank | In Labor Force | Age 30-34 |
| Panamanians | 3.8 /100 | #222 | Tragic 84.2% |
| Immigrants | Laos | 3.6 /100 | #223 | Tragic 84.2% |
| Cubans | 3.4 /100 | #224 | Tragic 84.2% |
| Scottish | 3.1 /100 | #225 | Tragic 84.2% |
| Immigrants | El Salvador | 3.0 /100 | #226 | Tragic 84.2% |
| Immigrants | Cuba | 3.0 /100 | #227 | Tragic 84.2% |
| Immigrants | Haiti | 2.8 /100 | #228 | Tragic 84.2% |
| Welsh | 2.7 /100 | #229 | Tragic 84.2% |
| Immigrants | Bahamas | 2.6 /100 | #230 | Tragic 84.1% |
| Malaysians | 2.2 /100 | #231 | Tragic 84.1% |
| Immigrants | Immigrants | 2.0 /100 | #232 | Tragic 84.1% |
| West Indians | 1.9 /100 | #233 | Tragic 84.1% |
| Haitians | 1.8 /100 | #234 | Tragic 84.1% |
| French American Indians | 1.7 /100 | #235 | Tragic 84.1% |
| U.S. Virgin Islanders | 1.5 /100 | #236 | Tragic 84.1% |
Demographics Similar to Tlingit-Haida by In Labor Force | Age 30-34
In terms of in labor force | age 30-34, the demographic groups most similar to Tlingit-Haida are Immigrants from Micronesia (82.4%, a difference of 0.080%), Osage (82.3%, a difference of 0.080%), Ottawa (82.4%, a difference of 0.090%), Spanish American Indian (82.2%, a difference of 0.090%), and Hispanic or Latino (82.4%, a difference of 0.12%).
| Demographics | Rating | Rank | In Labor Force | Age 30-34 |
| Comanche | 0.0 /100 | #297 | Tragic 82.6% |
| Aleuts | 0.0 /100 | #298 | Tragic 82.6% |
| Immigrants | Central America | 0.0 /100 | #299 | Tragic 82.5% |
| Hmong | 0.0 /100 | #300 | Tragic 82.4% |
| Hispanics or Latinos | 0.0 /100 | #301 | Tragic 82.4% |
| Ottawa | 0.0 /100 | #302 | Tragic 82.4% |
| Immigrants | Micronesia | 0.0 /100 | #303 | Tragic 82.4% |
| Tlingit-Haida | 0.0 /100 | #304 | Tragic 82.3% |
| Osage | 0.0 /100 | #305 | Tragic 82.3% |
| Spanish American Indians | 0.0 /100 | #306 | Tragic 82.2% |
| Menominee | 0.0 /100 | #307 | Tragic 82.2% |
| Puget Sound Salish | 0.0 /100 | #308 | Tragic 82.1% |
| Immigrants | Mexico | 0.0 /100 | #309 | Tragic 82.0% |
| Cajuns | 0.0 /100 | #310 | Tragic 82.0% |
| Chickasaw | 0.0 /100 | #311 | Tragic 81.9% |