Immigrants from Dominican Republic vs Tlingit-Haida Disability Age Over 75
COMPARE
Immigrants from Dominican Republic
Tlingit-Haida
Disability Age Over 75
Disability Age Over 75 Comparison
Immigrants from Dominican Republic
Tlingit-Haida
50.3%
DISABILITY AGE OVER 75
0.0/ 100
METRIC RATING
304th/ 347
METRIC RANK
50.6%
DISABILITY AGE OVER 75
0.0/ 100
METRIC RATING
310th/ 347
METRIC RANK
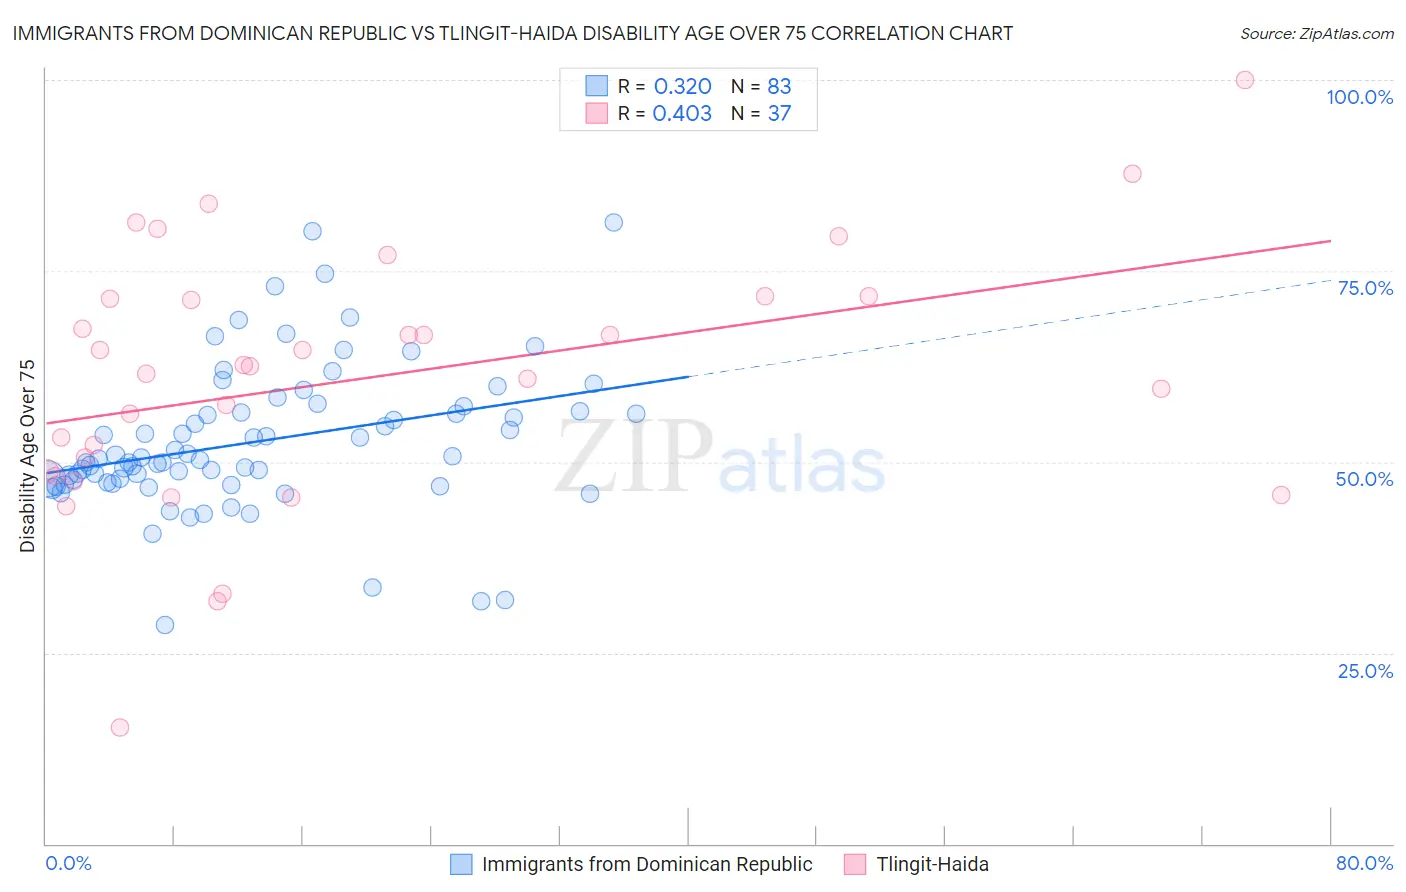
Immigrants from Dominican Republic vs Tlingit-Haida Disability Age Over 75 Correlation Chart
The statistical analysis conducted on geographies consisting of 274,580,835 people shows a mild positive correlation between the proportion of Immigrants from Dominican Republic and percentage of population with a disability over the age of 75 in the United States with a correlation coefficient (R) of 0.320 and weighted average of 50.3%. Similarly, the statistical analysis conducted on geographies consisting of 60,768,842 people shows a moderate positive correlation between the proportion of Tlingit-Haida and percentage of population with a disability over the age of 75 in the United States with a correlation coefficient (R) of 0.403 and weighted average of 50.6%, a difference of 0.62%.
Disability Age Over 75 Correlation Summary
| Measurement | Immigrants from Dominican Republic | Tlingit-Haida |
| Minimum | 28.7% | 15.2% |
| Maximum | 81.4% | 100.0% |
| Range | 52.8% | 84.8% |
| Mean | 52.6% | 60.9% |
| Median | 50.4% | 62.5% |
| Interquartile 25% (IQ1) | 47.3% | 48.4% |
| Interquartile 75% (IQ3) | 56.6% | 71.5% |
| Interquartile Range (IQR) | 9.3% | 23.0% |
| Standard Deviation (Sample) | 9.6% | 16.9% |
| Standard Deviation (Population) | 9.5% | 16.7% |
Demographics Similar to Immigrants from Dominican Republic and Tlingit-Haida by Disability Age Over 75
In terms of disability age over 75, the demographic groups most similar to Immigrants from Dominican Republic are Japanese (50.2%, a difference of 0.11%), Cherokee (50.2%, a difference of 0.12%), Dominican (50.2%, a difference of 0.28%), Cape Verdean (50.1%, a difference of 0.34%), and Immigrants from Micronesia (50.1%, a difference of 0.37%). Similarly, the demographic groups most similar to Tlingit-Haida are Hispanic or Latino (50.6%, a difference of 0.040%), Aleut (50.6%, a difference of 0.040%), Immigrants from Fiji (50.6%, a difference of 0.070%), Cajun (50.7%, a difference of 0.10%), and Immigrants from Central America (50.5%, a difference of 0.12%).
| Demographics | Rating | Rank | Disability Age Over 75 |
| Armenians | 0.0 /100 | #297 | Tragic 50.0% |
| Marshallese | 0.0 /100 | #298 | Tragic 50.1% |
| Immigrants | Micronesia | 0.0 /100 | #299 | Tragic 50.1% |
| Cape Verdeans | 0.0 /100 | #300 | Tragic 50.1% |
| Dominicans | 0.0 /100 | #301 | Tragic 50.2% |
| Cherokee | 0.0 /100 | #302 | Tragic 50.2% |
| Japanese | 0.0 /100 | #303 | Tragic 50.2% |
| Immigrants | Dominican Republic | 0.0 /100 | #304 | Tragic 50.3% |
| Central American Indians | 0.0 /100 | #305 | Tragic 50.5% |
| Immigrants | Central America | 0.0 /100 | #306 | Tragic 50.5% |
| Immigrants | Fiji | 0.0 /100 | #307 | Tragic 50.6% |
| Hispanics or Latinos | 0.0 /100 | #308 | Tragic 50.6% |
| Aleuts | 0.0 /100 | #309 | Tragic 50.6% |
| Tlingit-Haida | 0.0 /100 | #310 | Tragic 50.6% |
| Cajuns | 0.0 /100 | #311 | Tragic 50.7% |
| Cheyenne | 0.0 /100 | #312 | Tragic 50.9% |
| Immigrants | Azores | 0.0 /100 | #313 | Tragic 50.9% |
| Immigrants | Mexico | 0.0 /100 | #314 | Tragic 51.1% |
| Mexicans | 0.0 /100 | #315 | Tragic 51.1% |
| Chickasaw | 0.0 /100 | #316 | Tragic 51.2% |
| Yakama | 0.0 /100 | #317 | Tragic 51.3% |