Eastern European vs Tlingit-Haida Disability Age Over 75
COMPARE
Eastern European
Tlingit-Haida
Disability Age Over 75
Disability Age Over 75 Comparison
Eastern Europeans
Tlingit-Haida
44.8%
DISABILITY AGE OVER 75
100.0/ 100
METRIC RATING
3rd/ 347
METRIC RANK
50.6%
DISABILITY AGE OVER 75
0.0/ 100
METRIC RATING
310th/ 347
METRIC RANK
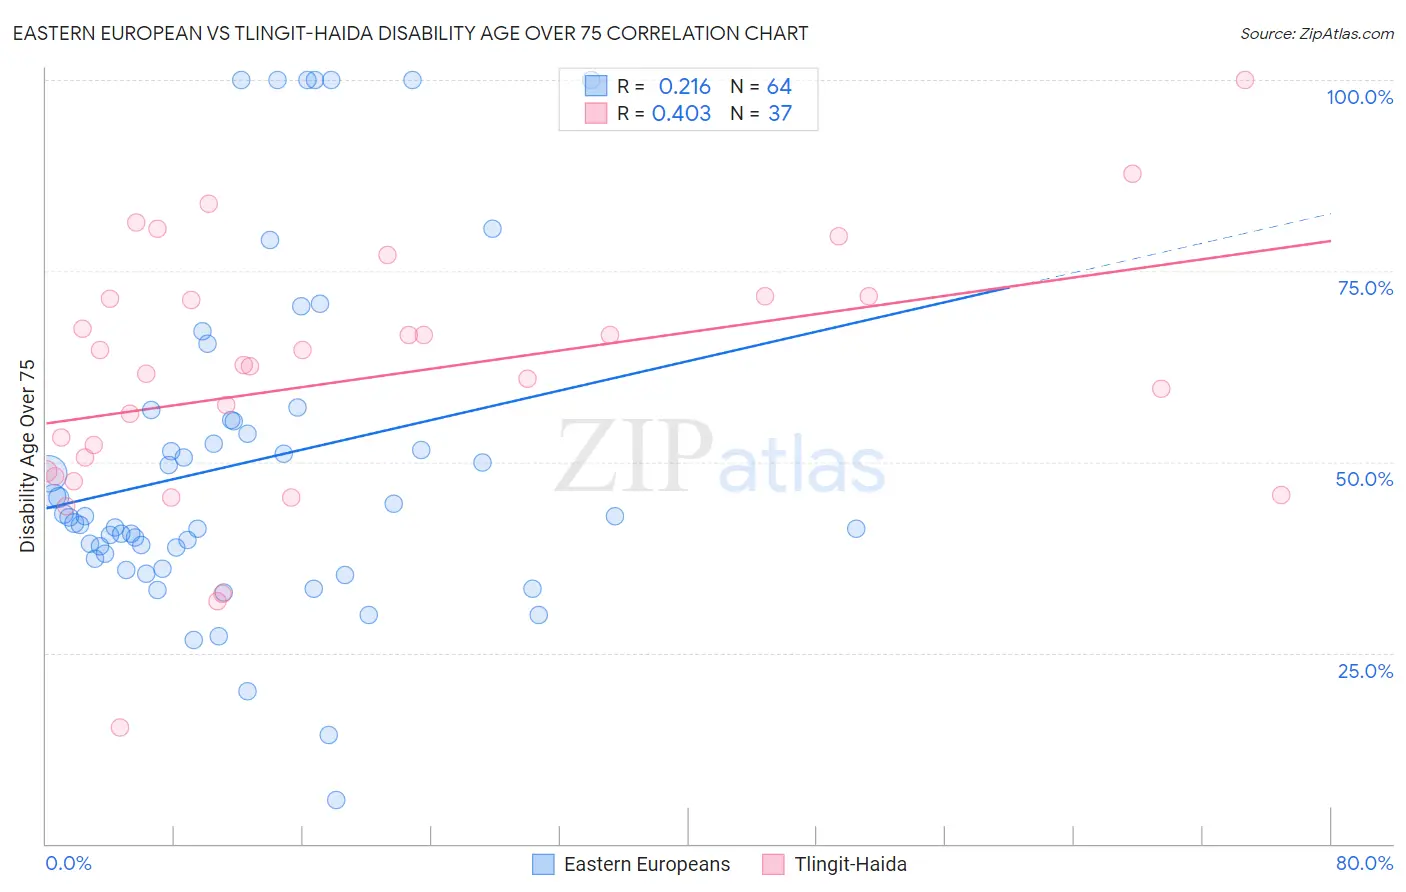
Eastern European vs Tlingit-Haida Disability Age Over 75 Correlation Chart
The statistical analysis conducted on geographies consisting of 460,398,021 people shows a weak positive correlation between the proportion of Eastern Europeans and percentage of population with a disability over the age of 75 in the United States with a correlation coefficient (R) of 0.216 and weighted average of 44.8%. Similarly, the statistical analysis conducted on geographies consisting of 60,768,842 people shows a moderate positive correlation between the proportion of Tlingit-Haida and percentage of population with a disability over the age of 75 in the United States with a correlation coefficient (R) of 0.403 and weighted average of 50.6%, a difference of 13.0%.
Disability Age Over 75 Correlation Summary
| Measurement | Eastern European | Tlingit-Haida |
| Minimum | 5.7% | 15.2% |
| Maximum | 100.0% | 100.0% |
| Range | 94.3% | 84.8% |
| Mean | 49.9% | 60.9% |
| Median | 42.8% | 62.5% |
| Interquartile 25% (IQ1) | 37.7% | 48.4% |
| Interquartile 75% (IQ3) | 55.5% | 71.5% |
| Interquartile Range (IQR) | 17.8% | 23.0% |
| Standard Deviation (Sample) | 22.1% | 16.9% |
| Standard Deviation (Population) | 21.9% | 16.7% |
Similar Demographics by Disability Age Over 75
Demographics Similar to Eastern Europeans by Disability Age Over 75
In terms of disability age over 75, the demographic groups most similar to Eastern Europeans are Carpatho Rusyn (44.8%, a difference of 0.030%), Luxembourger (44.8%, a difference of 0.090%), Immigrants from Lithuania (44.9%, a difference of 0.18%), Okinawan (44.9%, a difference of 0.22%), and Immigrants from Ireland (44.7%, a difference of 0.29%).
| Demographics | Rating | Rank | Disability Age Over 75 |
| Cypriots | 100.0 /100 | #1 | Exceptional 43.5% |
| Immigrants | Ireland | 100.0 /100 | #2 | Exceptional 44.7% |
| Eastern Europeans | 100.0 /100 | #3 | Exceptional 44.8% |
| Carpatho Rusyns | 100.0 /100 | #4 | Exceptional 44.8% |
| Luxembourgers | 100.0 /100 | #5 | Exceptional 44.8% |
| Immigrants | Lithuania | 100.0 /100 | #6 | Exceptional 44.9% |
| Okinawans | 100.0 /100 | #7 | Exceptional 44.9% |
| Immigrants | Austria | 100.0 /100 | #8 | Exceptional 44.9% |
| Paraguayans | 100.0 /100 | #9 | Exceptional 45.0% |
| Bulgarians | 100.0 /100 | #10 | Exceptional 45.1% |
| Lithuanians | 100.0 /100 | #11 | Exceptional 45.1% |
| Immigrants | Czechoslovakia | 100.0 /100 | #12 | Exceptional 45.1% |
| Latvians | 100.0 /100 | #13 | Exceptional 45.1% |
| Immigrants | Scotland | 100.0 /100 | #14 | Exceptional 45.1% |
| Immigrants | Sweden | 100.0 /100 | #15 | Exceptional 45.1% |
Demographics Similar to Tlingit-Haida by Disability Age Over 75
In terms of disability age over 75, the demographic groups most similar to Tlingit-Haida are Hispanic or Latino (50.6%, a difference of 0.040%), Aleut (50.6%, a difference of 0.040%), Immigrants from Fiji (50.6%, a difference of 0.070%), Cajun (50.7%, a difference of 0.10%), and Immigrants from Central America (50.5%, a difference of 0.12%).
| Demographics | Rating | Rank | Disability Age Over 75 |
| Japanese | 0.0 /100 | #303 | Tragic 50.2% |
| Immigrants | Dominican Republic | 0.0 /100 | #304 | Tragic 50.3% |
| Central American Indians | 0.0 /100 | #305 | Tragic 50.5% |
| Immigrants | Central America | 0.0 /100 | #306 | Tragic 50.5% |
| Immigrants | Fiji | 0.0 /100 | #307 | Tragic 50.6% |
| Hispanics or Latinos | 0.0 /100 | #308 | Tragic 50.6% |
| Aleuts | 0.0 /100 | #309 | Tragic 50.6% |
| Tlingit-Haida | 0.0 /100 | #310 | Tragic 50.6% |
| Cajuns | 0.0 /100 | #311 | Tragic 50.7% |
| Cheyenne | 0.0 /100 | #312 | Tragic 50.9% |
| Immigrants | Azores | 0.0 /100 | #313 | Tragic 50.9% |
| Immigrants | Mexico | 0.0 /100 | #314 | Tragic 51.1% |
| Mexicans | 0.0 /100 | #315 | Tragic 51.1% |
| Chickasaw | 0.0 /100 | #316 | Tragic 51.2% |
| Yakama | 0.0 /100 | #317 | Tragic 51.3% |