Welsh vs Immigrants from Afghanistan Disability Age Over 75
COMPARE
Welsh
Immigrants from Afghanistan
Disability Age Over 75
Disability Age Over 75 Comparison
Welsh
Immigrants from Afghanistan
47.0%
DISABILITY AGE OVER 75
81.3/ 100
METRIC RATING
149th/ 347
METRIC RANK
48.8%
DISABILITY AGE OVER 75
0.4/ 100
METRIC RATING
260th/ 347
METRIC RANK
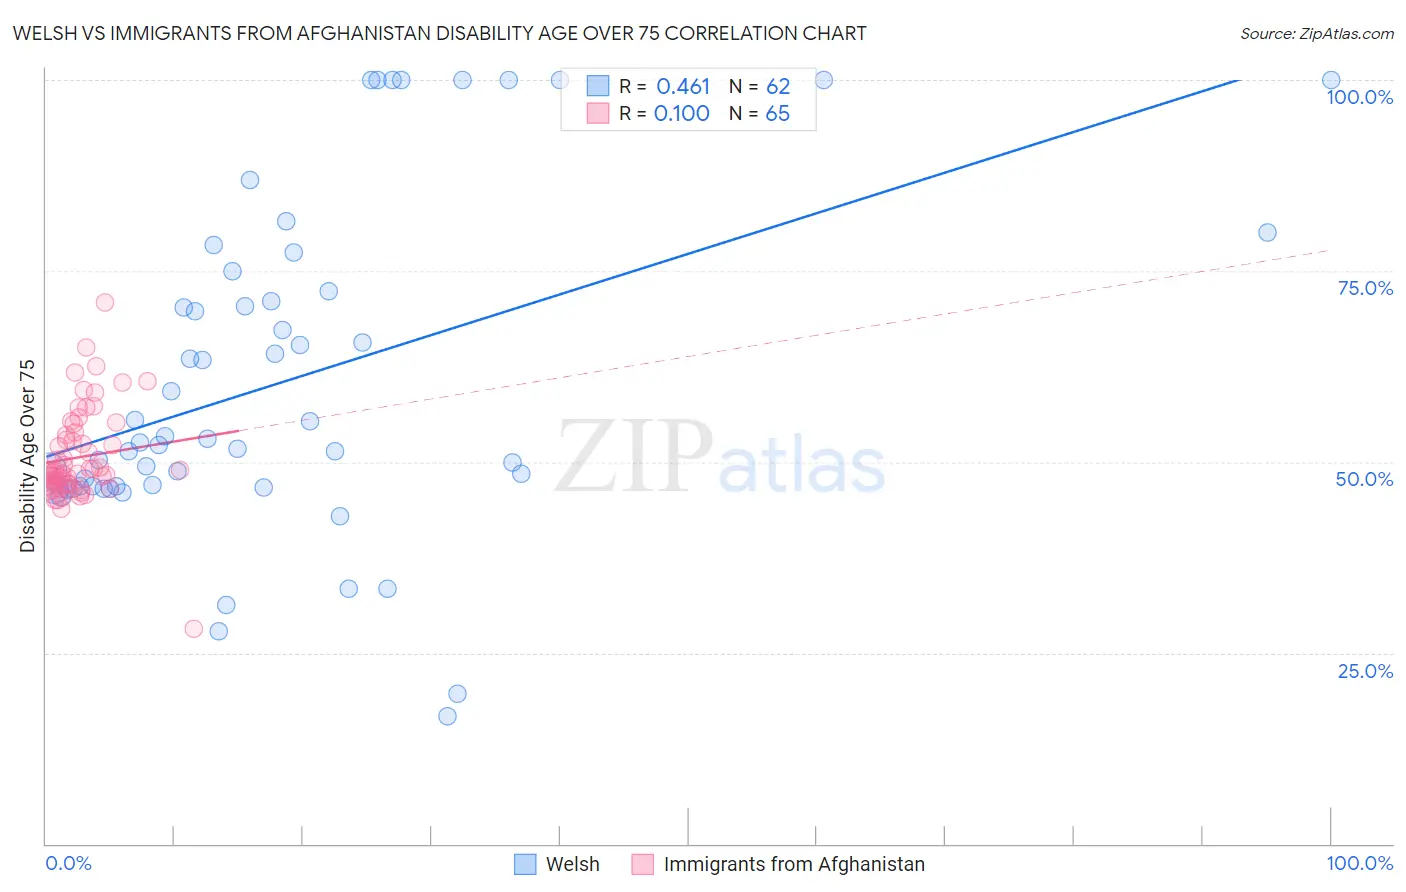
Welsh vs Immigrants from Afghanistan Disability Age Over 75 Correlation Chart
The statistical analysis conducted on geographies consisting of 527,126,487 people shows a moderate positive correlation between the proportion of Welsh and percentage of population with a disability over the age of 75 in the United States with a correlation coefficient (R) of 0.461 and weighted average of 47.0%. Similarly, the statistical analysis conducted on geographies consisting of 147,547,224 people shows a poor positive correlation between the proportion of Immigrants from Afghanistan and percentage of population with a disability over the age of 75 in the United States with a correlation coefficient (R) of 0.100 and weighted average of 48.8%, a difference of 4.0%.
Disability Age Over 75 Correlation Summary
| Measurement | Welsh | Immigrants from Afghanistan |
| Minimum | 16.7% | 28.2% |
| Maximum | 100.0% | 70.8% |
| Range | 83.3% | 42.6% |
| Mean | 60.7% | 50.6% |
| Median | 52.8% | 48.6% |
| Interquartile 25% (IQ1) | 46.8% | 47.1% |
| Interquartile 75% (IQ3) | 72.3% | 53.7% |
| Interquartile Range (IQR) | 25.5% | 6.6% |
| Standard Deviation (Sample) | 21.5% | 6.2% |
| Standard Deviation (Population) | 21.3% | 6.2% |
Similar Demographics by Disability Age Over 75
Demographics Similar to Welsh by Disability Age Over 75
In terms of disability age over 75, the demographic groups most similar to Welsh are Asian (46.9%, a difference of 0.010%), Immigrants from Russia (47.0%, a difference of 0.070%), French Canadian (47.0%, a difference of 0.080%), Immigrants from Peru (46.9%, a difference of 0.11%), and Guyanese (46.9%, a difference of 0.12%).
| Demographics | Rating | Rank | Disability Age Over 75 |
| Peruvians | 86.5 /100 | #142 | Excellent 46.8% |
| Bermudans | 85.6 /100 | #143 | Excellent 46.9% |
| Venezuelans | 85.0 /100 | #144 | Excellent 46.9% |
| Costa Ricans | 84.5 /100 | #145 | Excellent 46.9% |
| Guyanese | 84.3 /100 | #146 | Excellent 46.9% |
| Immigrants | Peru | 84.1 /100 | #147 | Excellent 46.9% |
| Asians | 81.6 /100 | #148 | Excellent 46.9% |
| Welsh | 81.3 /100 | #149 | Excellent 47.0% |
| Immigrants | Russia | 79.3 /100 | #150 | Good 47.0% |
| French Canadians | 79.0 /100 | #151 | Good 47.0% |
| Immigrants | Asia | 76.5 /100 | #152 | Good 47.0% |
| Immigrants | Zaire | 74.8 /100 | #153 | Good 47.1% |
| Immigrants | Belarus | 74.8 /100 | #154 | Good 47.1% |
| Immigrants | Iran | 74.7 /100 | #155 | Good 47.1% |
| Arabs | 73.3 /100 | #156 | Good 47.1% |
Demographics Similar to Immigrants from Afghanistan by Disability Age Over 75
In terms of disability age over 75, the demographic groups most similar to Immigrants from Afghanistan are Central American (48.8%, a difference of 0.040%), African (48.9%, a difference of 0.060%), Immigrants from Philippines (48.8%, a difference of 0.11%), Immigrants from West Indies (48.9%, a difference of 0.12%), and Salvadoran (48.9%, a difference of 0.13%).
| Demographics | Rating | Rank | Disability Age Over 75 |
| British West Indians | 0.6 /100 | #253 | Tragic 48.7% |
| Immigrants | Vietnam | 0.6 /100 | #254 | Tragic 48.7% |
| Chinese | 0.5 /100 | #255 | Tragic 48.7% |
| Immigrants | Congo | 0.5 /100 | #256 | Tragic 48.7% |
| Blackfeet | 0.5 /100 | #257 | Tragic 48.8% |
| Immigrants | Philippines | 0.4 /100 | #258 | Tragic 48.8% |
| Central Americans | 0.4 /100 | #259 | Tragic 48.8% |
| Immigrants | Afghanistan | 0.4 /100 | #260 | Tragic 48.8% |
| Africans | 0.3 /100 | #261 | Tragic 48.9% |
| Immigrants | West Indies | 0.3 /100 | #262 | Tragic 48.9% |
| Salvadorans | 0.3 /100 | #263 | Tragic 48.9% |
| Immigrants | Honduras | 0.3 /100 | #264 | Tragic 48.9% |
| Hondurans | 0.3 /100 | #265 | Tragic 48.9% |
| U.S. Virgin Islanders | 0.2 /100 | #266 | Tragic 48.9% |
| Malaysians | 0.2 /100 | #267 | Tragic 49.0% |