Northern European vs Laotian Vision Disability
COMPARE
Northern European
Laotian
Vision Disability
Vision Disability Comparison
Northern Europeans
Laotians
2.2%
VISION DISABILITY
50.1/ 100
METRIC RATING
172nd/ 347
METRIC RANK
2.0%
VISION DISABILITY
99.3/ 100
METRIC RATING
55th/ 347
METRIC RANK
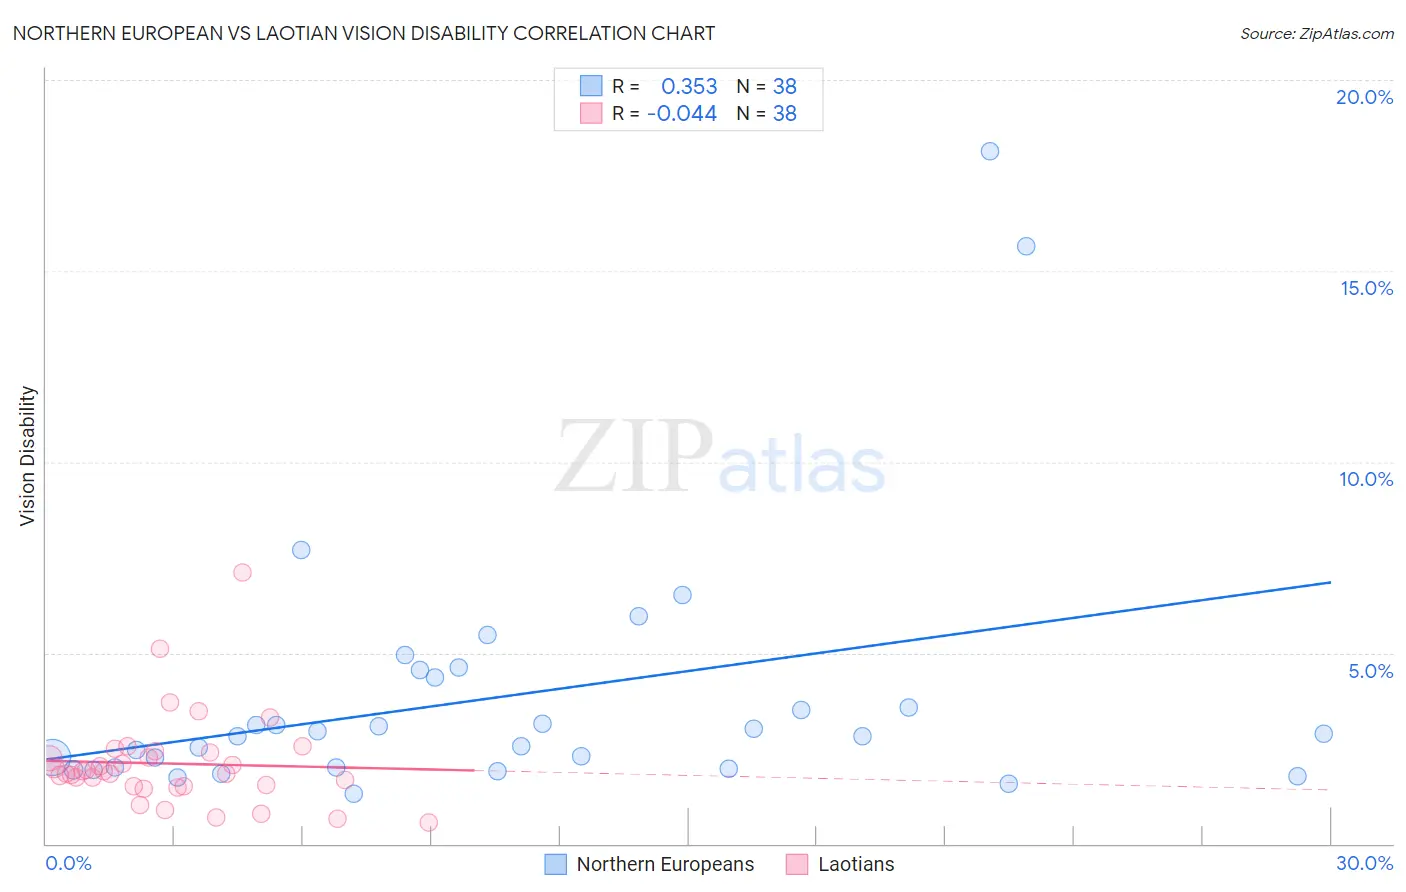
Northern European vs Laotian Vision Disability Correlation Chart
The statistical analysis conducted on geographies consisting of 405,711,615 people shows a mild positive correlation between the proportion of Northern Europeans and percentage of population with vision disability in the United States with a correlation coefficient (R) of 0.353 and weighted average of 2.2%. Similarly, the statistical analysis conducted on geographies consisting of 224,815,117 people shows no correlation between the proportion of Laotians and percentage of population with vision disability in the United States with a correlation coefficient (R) of -0.044 and weighted average of 2.0%, a difference of 8.5%.
Vision Disability Correlation Summary
| Measurement | Northern European | Laotian |
| Minimum | 1.3% | 0.55% |
| Maximum | 18.1% | 7.1% |
| Range | 16.8% | 6.5% |
| Mean | 3.8% | 2.1% |
| Median | 2.8% | 1.9% |
| Interquartile 25% (IQ1) | 2.0% | 1.5% |
| Interquartile 75% (IQ3) | 4.4% | 2.4% |
| Interquartile Range (IQR) | 2.4% | 0.88% |
| Standard Deviation (Sample) | 3.5% | 1.2% |
| Standard Deviation (Population) | 3.4% | 1.2% |
Similar Demographics by Vision Disability
Demographics Similar to Northern Europeans by Vision Disability
In terms of vision disability, the demographic groups most similar to Northern Europeans are Scandinavian (2.2%, a difference of 0.0%), Immigrants from Canada (2.2%, a difference of 0.010%), Immigrants from Fiji (2.2%, a difference of 0.16%), Yugoslavian (2.2%, a difference of 0.22%), and Lebanese (2.2%, a difference of 0.26%).
| Demographics | Rating | Rank | Vision Disability |
| Immigrants | Iraq | 64.8 /100 | #165 | Good 2.1% |
| Immigrants | England | 62.8 /100 | #166 | Good 2.1% |
| Immigrants | Africa | 62.6 /100 | #167 | Good 2.1% |
| Brazilians | 62.2 /100 | #168 | Good 2.1% |
| South American Indians | 57.4 /100 | #169 | Average 2.2% |
| Swiss | 55.7 /100 | #170 | Average 2.2% |
| Lebanese | 54.3 /100 | #171 | Average 2.2% |
| Northern Europeans | 50.1 /100 | #172 | Average 2.2% |
| Scandinavians | 50.0 /100 | #173 | Average 2.2% |
| Immigrants | Canada | 50.0 /100 | #174 | Average 2.2% |
| Immigrants | Fiji | 47.6 /100 | #175 | Average 2.2% |
| Yugoslavians | 46.5 /100 | #176 | Average 2.2% |
| Slavs | 46.0 /100 | #177 | Average 2.2% |
| Immigrants | Oceania | 45.1 /100 | #178 | Average 2.2% |
| Immigrants | North America | 44.5 /100 | #179 | Average 2.2% |
Demographics Similar to Laotians by Vision Disability
In terms of vision disability, the demographic groups most similar to Laotians are Macedonian (2.0%, a difference of 0.060%), Immigrants from Belarus (2.0%, a difference of 0.090%), Jordanian (2.0%, a difference of 0.17%), Somali (2.0%, a difference of 0.19%), and Immigrants from Serbia (2.0%, a difference of 0.21%).
| Demographics | Rating | Rank | Vision Disability |
| Israelis | 99.6 /100 | #48 | Exceptional 2.0% |
| Latvians | 99.5 /100 | #49 | Exceptional 2.0% |
| Afghans | 99.5 /100 | #50 | Exceptional 2.0% |
| Tongans | 99.5 /100 | #51 | Exceptional 2.0% |
| Immigrants | Serbia | 99.4 /100 | #52 | Exceptional 2.0% |
| Immigrants | Belarus | 99.3 /100 | #53 | Exceptional 2.0% |
| Macedonians | 99.3 /100 | #54 | Exceptional 2.0% |
| Laotians | 99.3 /100 | #55 | Exceptional 2.0% |
| Jordanians | 99.2 /100 | #56 | Exceptional 2.0% |
| Somalis | 99.2 /100 | #57 | Exceptional 2.0% |
| Immigrants | Saudi Arabia | 99.2 /100 | #58 | Exceptional 2.0% |
| Argentineans | 99.1 /100 | #59 | Exceptional 2.0% |
| Immigrants | Romania | 99.1 /100 | #60 | Exceptional 2.0% |
| Immigrants | Belgium | 99.1 /100 | #61 | Exceptional 2.0% |
| Immigrants | Russia | 99.1 /100 | #62 | Exceptional 2.0% |