Welsh vs Laotian 11th Grade
COMPARE
Welsh
Laotian
11th Grade
11th Grade Comparison
Welsh
Laotians
94.2%
11TH GRADE
99.9/ 100
METRIC RATING
31st/ 347
METRIC RANK
92.6%
11TH GRADE
54.4/ 100
METRIC RATING
171st/ 347
METRIC RANK
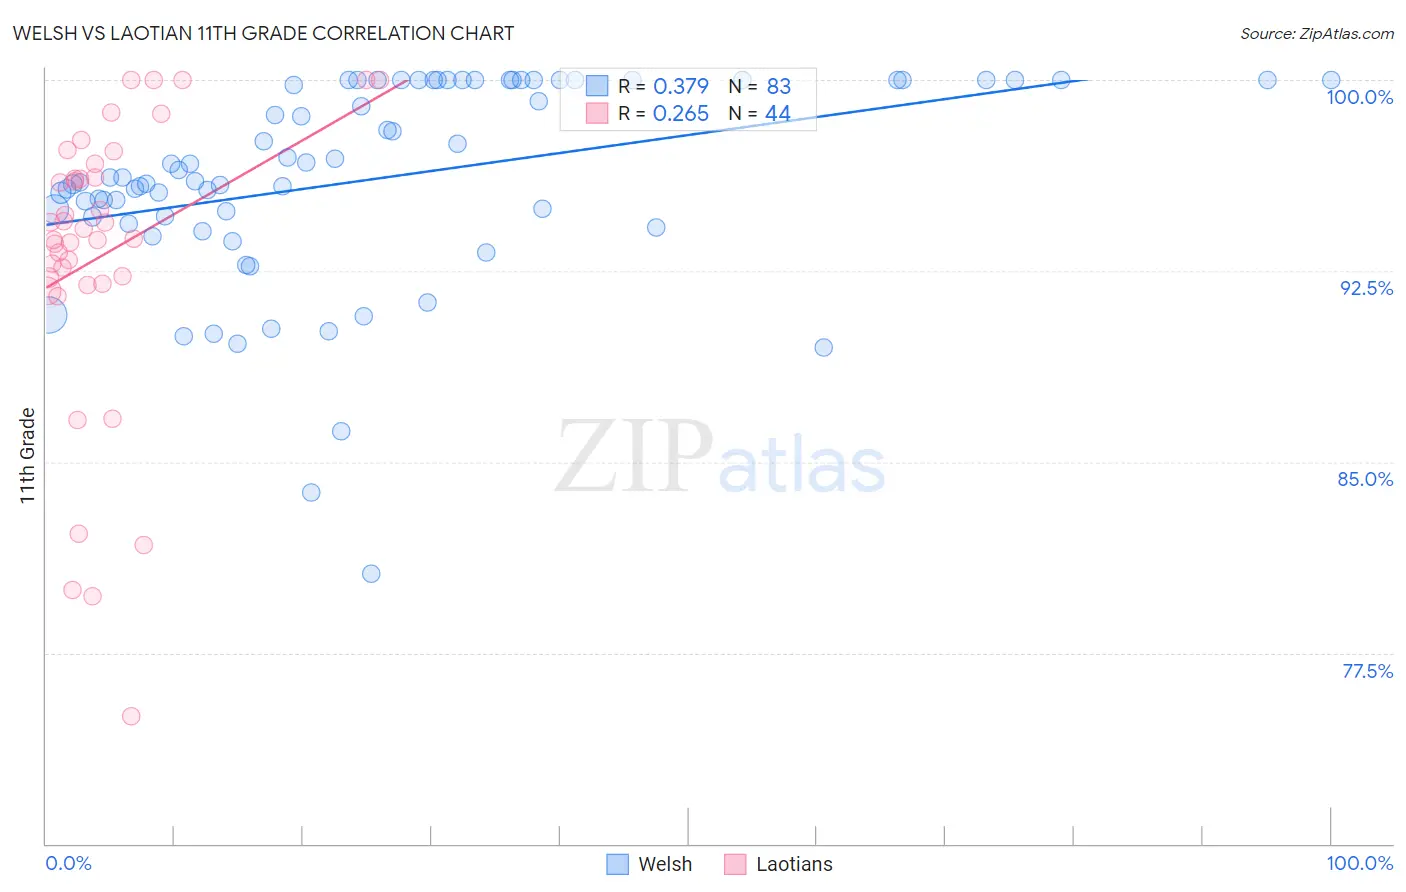
Welsh vs Laotian 11th Grade Correlation Chart
The statistical analysis conducted on geographies consisting of 528,596,196 people shows a mild positive correlation between the proportion of Welsh and percentage of population with at least 11th grade education in the United States with a correlation coefficient (R) of 0.379 and weighted average of 94.2%. Similarly, the statistical analysis conducted on geographies consisting of 224,854,130 people shows a weak positive correlation between the proportion of Laotians and percentage of population with at least 11th grade education in the United States with a correlation coefficient (R) of 0.265 and weighted average of 92.6%, a difference of 1.8%.
11th Grade Correlation Summary
| Measurement | Welsh | Laotian |
| Minimum | 80.6% | 75.0% |
| Maximum | 100.0% | 100.0% |
| Range | 19.4% | 25.0% |
| Mean | 96.1% | 93.1% |
| Median | 96.2% | 93.9% |
| Interquartile 25% (IQ1) | 94.6% | 92.1% |
| Interquartile 75% (IQ3) | 100.0% | 96.4% |
| Interquartile Range (IQR) | 5.4% | 4.3% |
| Standard Deviation (Sample) | 4.0% | 5.8% |
| Standard Deviation (Population) | 4.0% | 5.7% |
Similar Demographics by 11th Grade
Demographics Similar to Welsh by 11th Grade
In terms of 11th grade, the demographic groups most similar to Welsh are Belgian (94.2%, a difference of 0.0%), Russian (94.3%, a difference of 0.020%), British (94.2%, a difference of 0.040%), Immigrants from Scotland (94.2%, a difference of 0.040%), and Immigrants from Singapore (94.2%, a difference of 0.050%).
| Demographics | Rating | Rank | 11th Grade |
| English | 100.0 /100 | #24 | Exceptional 94.4% |
| Irish | 100.0 /100 | #25 | Exceptional 94.4% |
| Scottish | 100.0 /100 | #26 | Exceptional 94.4% |
| Europeans | 100.0 /100 | #27 | Exceptional 94.4% |
| Estonians | 100.0 /100 | #28 | Exceptional 94.4% |
| Dutch | 100.0 /100 | #29 | Exceptional 94.3% |
| Russians | 100.0 /100 | #30 | Exceptional 94.3% |
| Welsh | 99.9 /100 | #31 | Exceptional 94.2% |
| Belgians | 99.9 /100 | #32 | Exceptional 94.2% |
| British | 99.9 /100 | #33 | Exceptional 94.2% |
| Immigrants | Scotland | 99.9 /100 | #34 | Exceptional 94.2% |
| Immigrants | Singapore | 99.9 /100 | #35 | Exceptional 94.2% |
| Immigrants | Northern Europe | 99.9 /100 | #36 | Exceptional 94.2% |
| Northern Europeans | 99.9 /100 | #37 | Exceptional 94.2% |
| Hungarians | 99.9 /100 | #38 | Exceptional 94.2% |
Demographics Similar to Laotians by 11th Grade
In terms of 11th grade, the demographic groups most similar to Laotians are Immigrants from Pakistan (92.5%, a difference of 0.020%), Immigrants from Albania (92.6%, a difference of 0.030%), Immigrants from Northern Africa (92.6%, a difference of 0.030%), Indian (Asian) (92.5%, a difference of 0.030%), and Sierra Leonean (92.6%, a difference of 0.040%).
| Demographics | Rating | Rank | 11th Grade |
| Spanish | 66.2 /100 | #164 | Good 92.7% |
| Immigrants | Iraq | 63.7 /100 | #165 | Good 92.6% |
| Bermudans | 62.3 /100 | #166 | Good 92.6% |
| Alsatians | 60.2 /100 | #167 | Good 92.6% |
| Sierra Leoneans | 58.7 /100 | #168 | Average 92.6% |
| Immigrants | Albania | 57.8 /100 | #169 | Average 92.6% |
| Immigrants | Northern Africa | 57.3 /100 | #170 | Average 92.6% |
| Laotians | 54.4 /100 | #171 | Average 92.6% |
| Immigrants | Pakistan | 52.3 /100 | #172 | Average 92.5% |
| Indians (Asian) | 51.5 /100 | #173 | Average 92.5% |
| Asians | 50.0 /100 | #174 | Average 92.5% |
| Shoshone | 48.9 /100 | #175 | Average 92.5% |
| Spaniards | 46.9 /100 | #176 | Average 92.5% |
| Guamanians/Chamorros | 45.0 /100 | #177 | Average 92.5% |
| Sudanese | 43.4 /100 | #178 | Average 92.5% |