French Canadian vs Immigrants from Thailand Vision Disability
COMPARE
French Canadian
Immigrants from Thailand
Vision Disability
Vision Disability Comparison
French Canadians
Immigrants from Thailand
2.3%
VISION DISABILITY
3.9/ 100
METRIC RATING
221st/ 347
METRIC RANK
2.2%
VISION DISABILITY
20.1/ 100
METRIC RATING
200th/ 347
METRIC RANK
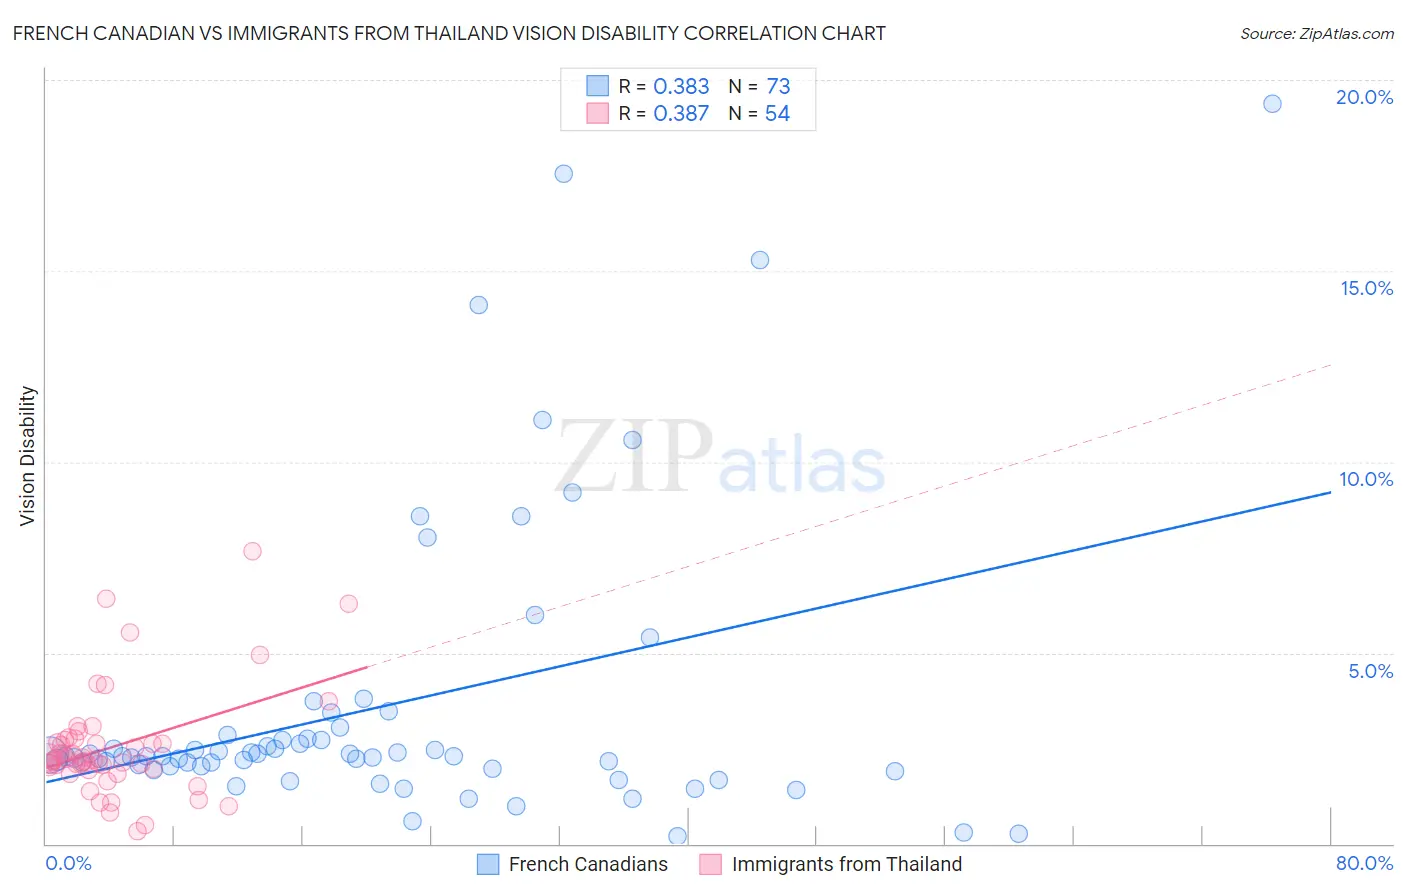
French Canadian vs Immigrants from Thailand Vision Disability Correlation Chart
The statistical analysis conducted on geographies consisting of 501,700,767 people shows a mild positive correlation between the proportion of French Canadians and percentage of population with vision disability in the United States with a correlation coefficient (R) of 0.383 and weighted average of 2.3%. Similarly, the statistical analysis conducted on geographies consisting of 316,876,708 people shows a mild positive correlation between the proportion of Immigrants from Thailand and percentage of population with vision disability in the United States with a correlation coefficient (R) of 0.387 and weighted average of 2.2%, a difference of 2.8%.
Vision Disability Correlation Summary
| Measurement | French Canadian | Immigrants from Thailand |
| Minimum | 0.20% | 0.34% |
| Maximum | 19.4% | 7.7% |
| Range | 19.2% | 7.3% |
| Mean | 3.6% | 2.5% |
| Median | 2.3% | 2.2% |
| Interquartile 25% (IQ1) | 2.0% | 2.0% |
| Interquartile 75% (IQ3) | 2.8% | 2.7% |
| Interquartile Range (IQR) | 0.79% | 0.75% |
| Standard Deviation (Sample) | 3.9% | 1.4% |
| Standard Deviation (Population) | 3.8% | 1.4% |
Similar Demographics by Vision Disability
Demographics Similar to French Canadians by Vision Disability
In terms of vision disability, the demographic groups most similar to French Canadians are Guamanian/Chamorro (2.3%, a difference of 0.020%), Immigrants from Senegal (2.3%, a difference of 0.020%), Basque (2.3%, a difference of 0.16%), Irish (2.3%, a difference of 0.19%), and Immigrants from Western Africa (2.3%, a difference of 0.20%).
| Demographics | Rating | Rank | Vision Disability |
| Trinidadians and Tobagonians | 8.2 /100 | #214 | Tragic 2.2% |
| Nigerians | 7.2 /100 | #215 | Tragic 2.3% |
| Immigrants | Trinidad and Tobago | 6.1 /100 | #216 | Tragic 2.3% |
| Barbadians | 5.1 /100 | #217 | Tragic 2.3% |
| Portuguese | 4.9 /100 | #218 | Tragic 2.3% |
| Ecuadorians | 4.6 /100 | #219 | Tragic 2.3% |
| Guamanians/Chamorros | 3.9 /100 | #220 | Tragic 2.3% |
| French Canadians | 3.9 /100 | #221 | Tragic 2.3% |
| Immigrants | Senegal | 3.8 /100 | #222 | Tragic 2.3% |
| Basques | 3.5 /100 | #223 | Tragic 2.3% |
| Irish | 3.4 /100 | #224 | Tragic 2.3% |
| Immigrants | Western Africa | 3.4 /100 | #225 | Tragic 2.3% |
| Immigrants | Germany | 3.0 /100 | #226 | Tragic 2.3% |
| Hawaiians | 2.9 /100 | #227 | Tragic 2.3% |
| Hmong | 2.5 /100 | #228 | Tragic 2.3% |
Demographics Similar to Immigrants from Thailand by Vision Disability
In terms of vision disability, the demographic groups most similar to Immigrants from Thailand are Immigrants from El Salvador (2.2%, a difference of 0.090%), Slovak (2.2%, a difference of 0.13%), Czechoslovakian (2.2%, a difference of 0.14%), Ghanaian (2.2%, a difference of 0.16%), and Immigrants from Zaire (2.2%, a difference of 0.22%).
| Demographics | Rating | Rank | Vision Disability |
| British | 25.1 /100 | #193 | Fair 2.2% |
| Immigrants | Barbados | 24.0 /100 | #194 | Fair 2.2% |
| Immigrants | Immigrants | 23.7 /100 | #195 | Fair 2.2% |
| Immigrants | Grenada | 23.1 /100 | #196 | Fair 2.2% |
| Ghanaians | 21.8 /100 | #197 | Fair 2.2% |
| Czechoslovakians | 21.6 /100 | #198 | Fair 2.2% |
| Immigrants | El Salvador | 21.0 /100 | #199 | Fair 2.2% |
| Immigrants | Thailand | 20.1 /100 | #200 | Fair 2.2% |
| Slovaks | 18.8 /100 | #201 | Poor 2.2% |
| Immigrants | Zaire | 18.0 /100 | #202 | Poor 2.2% |
| Dutch | 17.1 /100 | #203 | Poor 2.2% |
| Immigrants | Guyana | 15.9 /100 | #204 | Poor 2.2% |
| Samoans | 15.7 /100 | #205 | Poor 2.2% |
| Pennsylvania Germans | 14.5 /100 | #206 | Poor 2.2% |
| Immigrants | Nigeria | 13.5 /100 | #207 | Poor 2.2% |