Ethiopian vs Immigrants from Thailand Vision Disability
COMPARE
Ethiopian
Immigrants from Thailand
Vision Disability
Vision Disability Comparison
Ethiopians
Immigrants from Thailand
2.0%
VISION DISABILITY
99.7/ 100
METRIC RATING
45th/ 347
METRIC RANK
2.2%
VISION DISABILITY
20.1/ 100
METRIC RATING
200th/ 347
METRIC RANK
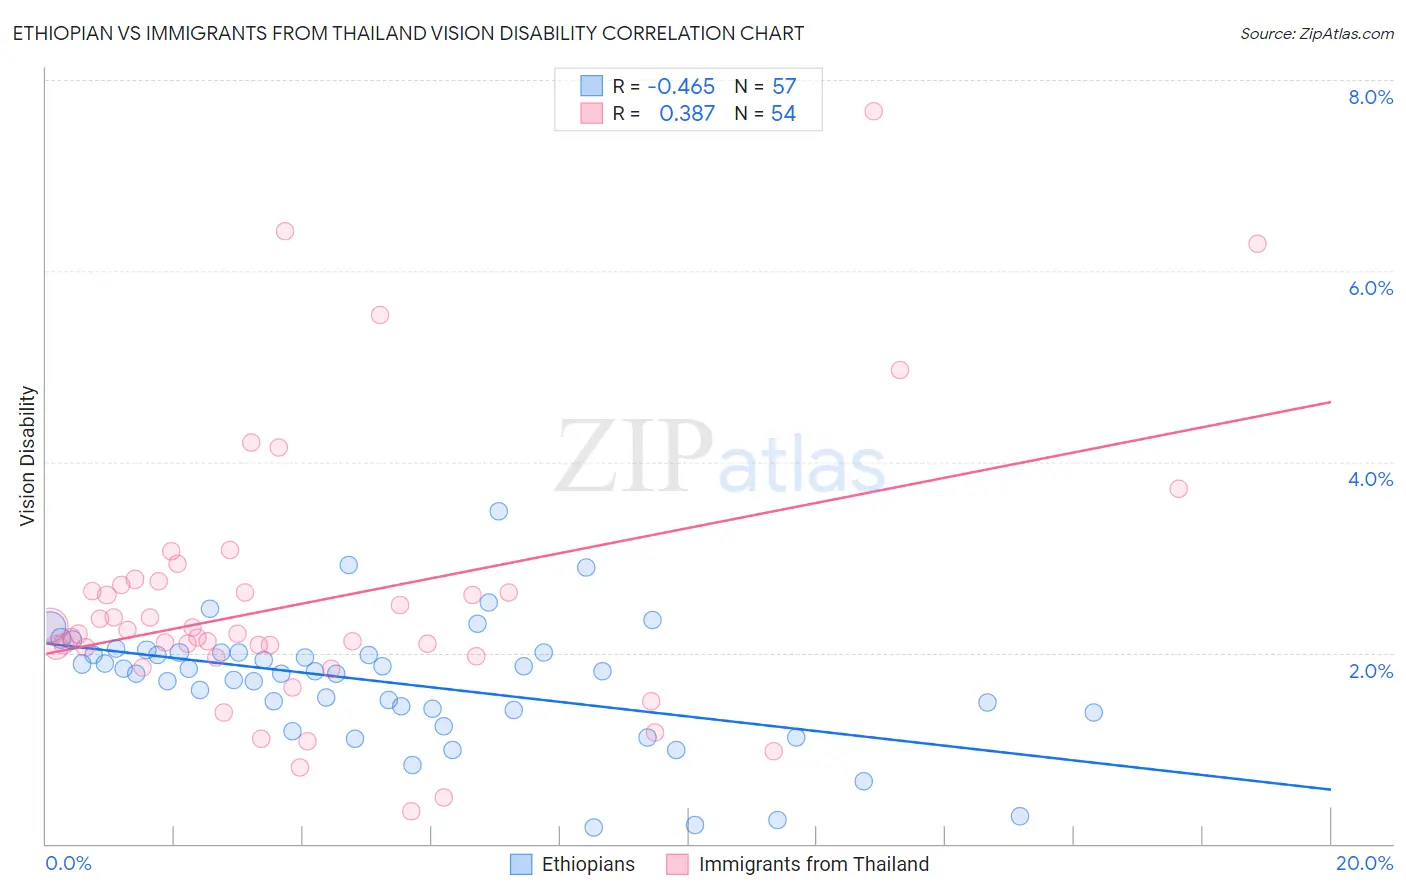
Ethiopian vs Immigrants from Thailand Vision Disability Correlation Chart
The statistical analysis conducted on geographies consisting of 223,170,588 people shows a moderate negative correlation between the proportion of Ethiopians and percentage of population with vision disability in the United States with a correlation coefficient (R) of -0.465 and weighted average of 2.0%. Similarly, the statistical analysis conducted on geographies consisting of 316,876,708 people shows a mild positive correlation between the proportion of Immigrants from Thailand and percentage of population with vision disability in the United States with a correlation coefficient (R) of 0.387 and weighted average of 2.2%, a difference of 12.2%.
Vision Disability Correlation Summary
| Measurement | Ethiopian | Immigrants from Thailand |
| Minimum | 0.17% | 0.34% |
| Maximum | 3.5% | 7.7% |
| Range | 3.3% | 7.3% |
| Mean | 1.7% | 2.5% |
| Median | 1.8% | 2.2% |
| Interquartile 25% (IQ1) | 1.4% | 2.0% |
| Interquartile 75% (IQ3) | 2.0% | 2.7% |
| Interquartile Range (IQR) | 0.62% | 0.75% |
| Standard Deviation (Sample) | 0.65% | 1.4% |
| Standard Deviation (Population) | 0.64% | 1.4% |
Similar Demographics by Vision Disability
Demographics Similar to Ethiopians by Vision Disability
In terms of vision disability, the demographic groups most similar to Ethiopians are Immigrants from Indonesia (2.0%, a difference of 0.030%), Immigrants from Sweden (2.0%, a difference of 0.040%), Eastern European (2.0%, a difference of 0.050%), Immigrants from Bulgaria (2.0%, a difference of 0.060%), and Immigrants from Ethiopia (2.0%, a difference of 0.11%).
| Demographics | Rating | Rank | Vision Disability |
| Immigrants | Kuwait | 99.8 /100 | #38 | Exceptional 2.0% |
| Zimbabweans | 99.7 /100 | #39 | Exceptional 2.0% |
| Immigrants | Ireland | 99.7 /100 | #40 | Exceptional 2.0% |
| Cypriots | 99.7 /100 | #41 | Exceptional 2.0% |
| Immigrants | Ethiopia | 99.7 /100 | #42 | Exceptional 2.0% |
| Eastern Europeans | 99.7 /100 | #43 | Exceptional 2.0% |
| Immigrants | Indonesia | 99.7 /100 | #44 | Exceptional 2.0% |
| Ethiopians | 99.7 /100 | #45 | Exceptional 2.0% |
| Immigrants | Sweden | 99.7 /100 | #46 | Exceptional 2.0% |
| Immigrants | Bulgaria | 99.7 /100 | #47 | Exceptional 2.0% |
| Israelis | 99.6 /100 | #48 | Exceptional 2.0% |
| Latvians | 99.5 /100 | #49 | Exceptional 2.0% |
| Afghans | 99.5 /100 | #50 | Exceptional 2.0% |
| Tongans | 99.5 /100 | #51 | Exceptional 2.0% |
| Immigrants | Serbia | 99.4 /100 | #52 | Exceptional 2.0% |
Demographics Similar to Immigrants from Thailand by Vision Disability
In terms of vision disability, the demographic groups most similar to Immigrants from Thailand are Immigrants from El Salvador (2.2%, a difference of 0.090%), Slovak (2.2%, a difference of 0.13%), Czechoslovakian (2.2%, a difference of 0.14%), Ghanaian (2.2%, a difference of 0.16%), and Immigrants from Zaire (2.2%, a difference of 0.22%).
| Demographics | Rating | Rank | Vision Disability |
| British | 25.1 /100 | #193 | Fair 2.2% |
| Immigrants | Barbados | 24.0 /100 | #194 | Fair 2.2% |
| Immigrants | Immigrants | 23.7 /100 | #195 | Fair 2.2% |
| Immigrants | Grenada | 23.1 /100 | #196 | Fair 2.2% |
| Ghanaians | 21.8 /100 | #197 | Fair 2.2% |
| Czechoslovakians | 21.6 /100 | #198 | Fair 2.2% |
| Immigrants | El Salvador | 21.0 /100 | #199 | Fair 2.2% |
| Immigrants | Thailand | 20.1 /100 | #200 | Fair 2.2% |
| Slovaks | 18.8 /100 | #201 | Poor 2.2% |
| Immigrants | Zaire | 18.0 /100 | #202 | Poor 2.2% |
| Dutch | 17.1 /100 | #203 | Poor 2.2% |
| Immigrants | Guyana | 15.9 /100 | #204 | Poor 2.2% |
| Samoans | 15.7 /100 | #205 | Poor 2.2% |
| Pennsylvania Germans | 14.5 /100 | #206 | Poor 2.2% |
| Immigrants | Nigeria | 13.5 /100 | #207 | Poor 2.2% |