Vietnamese vs Immigrants from Czechoslovakia Female Unemployment
COMPARE
Vietnamese
Immigrants from Czechoslovakia
Female Unemployment
Female Unemployment Comparison
Vietnamese
Immigrants from Czechoslovakia
6.5%
FEMALE UNEMPLOYMENT
0.0/ 100
METRIC RATING
322nd/ 347
METRIC RANK
5.0%
FEMALE UNEMPLOYMENT
95.0/ 100
METRIC RATING
101st/ 347
METRIC RANK
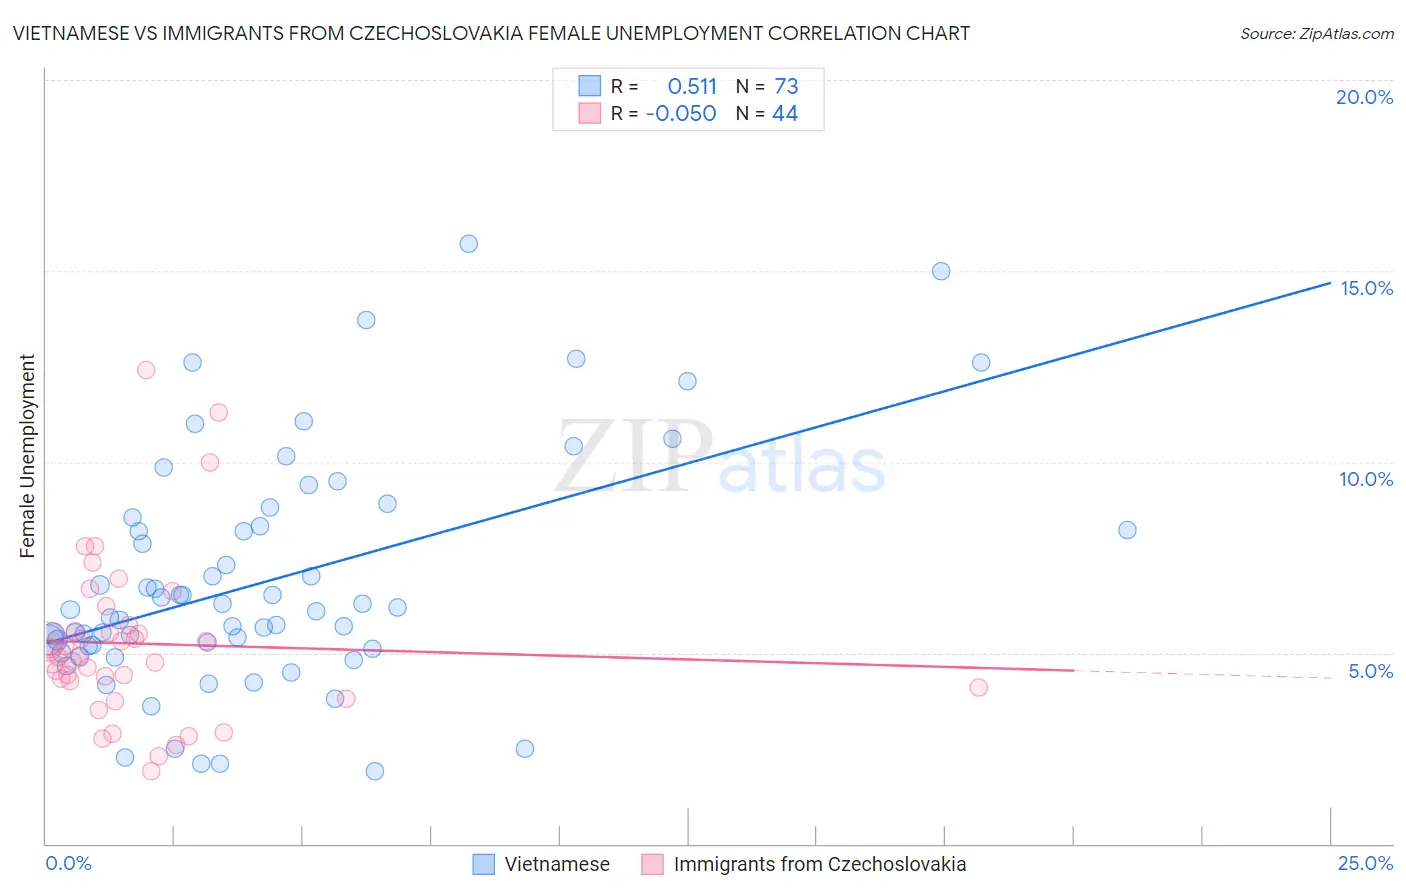
Vietnamese vs Immigrants from Czechoslovakia Female Unemployment Correlation Chart
The statistical analysis conducted on geographies consisting of 170,617,487 people shows a substantial positive correlation between the proportion of Vietnamese and unemploymnet rate among females in the United States with a correlation coefficient (R) of 0.511 and weighted average of 6.5%. Similarly, the statistical analysis conducted on geographies consisting of 195,172,474 people shows no correlation between the proportion of Immigrants from Czechoslovakia and unemploymnet rate among females in the United States with a correlation coefficient (R) of -0.050 and weighted average of 5.0%, a difference of 29.3%.
Female Unemployment Correlation Summary
| Measurement | Vietnamese | Immigrants from Czechoslovakia |
| Minimum | 1.9% | 1.9% |
| Maximum | 15.7% | 12.4% |
| Range | 13.8% | 10.5% |
| Mean | 6.9% | 5.2% |
| Median | 6.1% | 4.9% |
| Interquartile 25% (IQ1) | 5.1% | 4.2% |
| Interquartile 75% (IQ3) | 8.4% | 5.6% |
| Interquartile Range (IQR) | 3.3% | 1.5% |
| Standard Deviation (Sample) | 3.0% | 2.2% |
| Standard Deviation (Population) | 3.0% | 2.1% |
Similar Demographics by Female Unemployment
Demographics Similar to Vietnamese by Female Unemployment
In terms of female unemployment, the demographic groups most similar to Vietnamese are Black/African American (6.5%, a difference of 0.080%), Immigrants from Belize (6.5%, a difference of 0.10%), Immigrants from Dominica (6.5%, a difference of 0.62%), Immigrants from Bangladesh (6.5%, a difference of 0.63%), and British West Indian (6.4%, a difference of 0.82%).
| Demographics | Rating | Rank | Female Unemployment |
| Pueblo | 0.0 /100 | #315 | Tragic 6.4% |
| Houma | 0.0 /100 | #316 | Tragic 6.4% |
| Immigrants | St. Vincent and the Grenadines | 0.0 /100 | #317 | Tragic 6.4% |
| British West Indians | 0.0 /100 | #318 | Tragic 6.4% |
| Immigrants | Bangladesh | 0.0 /100 | #319 | Tragic 6.5% |
| Immigrants | Dominica | 0.0 /100 | #320 | Tragic 6.5% |
| Blacks/African Americans | 0.0 /100 | #321 | Tragic 6.5% |
| Vietnamese | 0.0 /100 | #322 | Tragic 6.5% |
| Immigrants | Belize | 0.0 /100 | #323 | Tragic 6.5% |
| Cheyenne | 0.0 /100 | #324 | Tragic 6.6% |
| Apache | 0.0 /100 | #325 | Tragic 6.6% |
| Natives/Alaskans | 0.0 /100 | #326 | Tragic 6.6% |
| Alaska Natives | 0.0 /100 | #327 | Tragic 6.6% |
| Guyanese | 0.0 /100 | #328 | Tragic 6.7% |
| Immigrants | Guyana | 0.0 /100 | #329 | Tragic 6.7% |
Demographics Similar to Immigrants from Czechoslovakia by Female Unemployment
In terms of female unemployment, the demographic groups most similar to Immigrants from Czechoslovakia are Indonesian (5.0%, a difference of 0.040%), Immigrants from Kenya (5.0%, a difference of 0.050%), Immigrants from Zaire (5.0%, a difference of 0.060%), Immigrants from Somalia (5.0%, a difference of 0.070%), and Immigrants from Kuwait (5.0%, a difference of 0.070%).
| Demographics | Rating | Rank | Female Unemployment |
| Immigrants | Malaysia | 95.7 /100 | #94 | Exceptional 5.0% |
| Burmese | 95.6 /100 | #95 | Exceptional 5.0% |
| Immigrants | South Central Asia | 95.5 /100 | #96 | Exceptional 5.0% |
| Immigrants | Somalia | 95.2 /100 | #97 | Exceptional 5.0% |
| Immigrants | Kuwait | 95.2 /100 | #98 | Exceptional 5.0% |
| Immigrants | Zaire | 95.2 /100 | #99 | Exceptional 5.0% |
| Indonesians | 95.1 /100 | #100 | Exceptional 5.0% |
| Immigrants | Czechoslovakia | 95.0 /100 | #101 | Exceptional 5.0% |
| Immigrants | Kenya | 94.8 /100 | #102 | Exceptional 5.0% |
| Somalis | 94.6 /100 | #103 | Exceptional 5.0% |
| Kenyans | 93.7 /100 | #104 | Exceptional 5.0% |
| Immigrants | England | 93.6 /100 | #105 | Exceptional 5.0% |
| Paraguayans | 93.2 /100 | #106 | Exceptional 5.1% |
| Immigrants | Switzerland | 93.1 /100 | #107 | Exceptional 5.1% |
| Puget Sound Salish | 93.0 /100 | #108 | Exceptional 5.1% |