Vietnamese vs Malaysian Ambulatory Disability
COMPARE
Vietnamese
Malaysian
Ambulatory Disability
Ambulatory Disability Comparison
Vietnamese
Malaysians
6.1%
AMBULATORY DISABILITY
47.2/ 100
METRIC RATING
175th/ 347
METRIC RANK
6.2%
AMBULATORY DISABILITY
28.2/ 100
METRIC RATING
196th/ 347
METRIC RANK
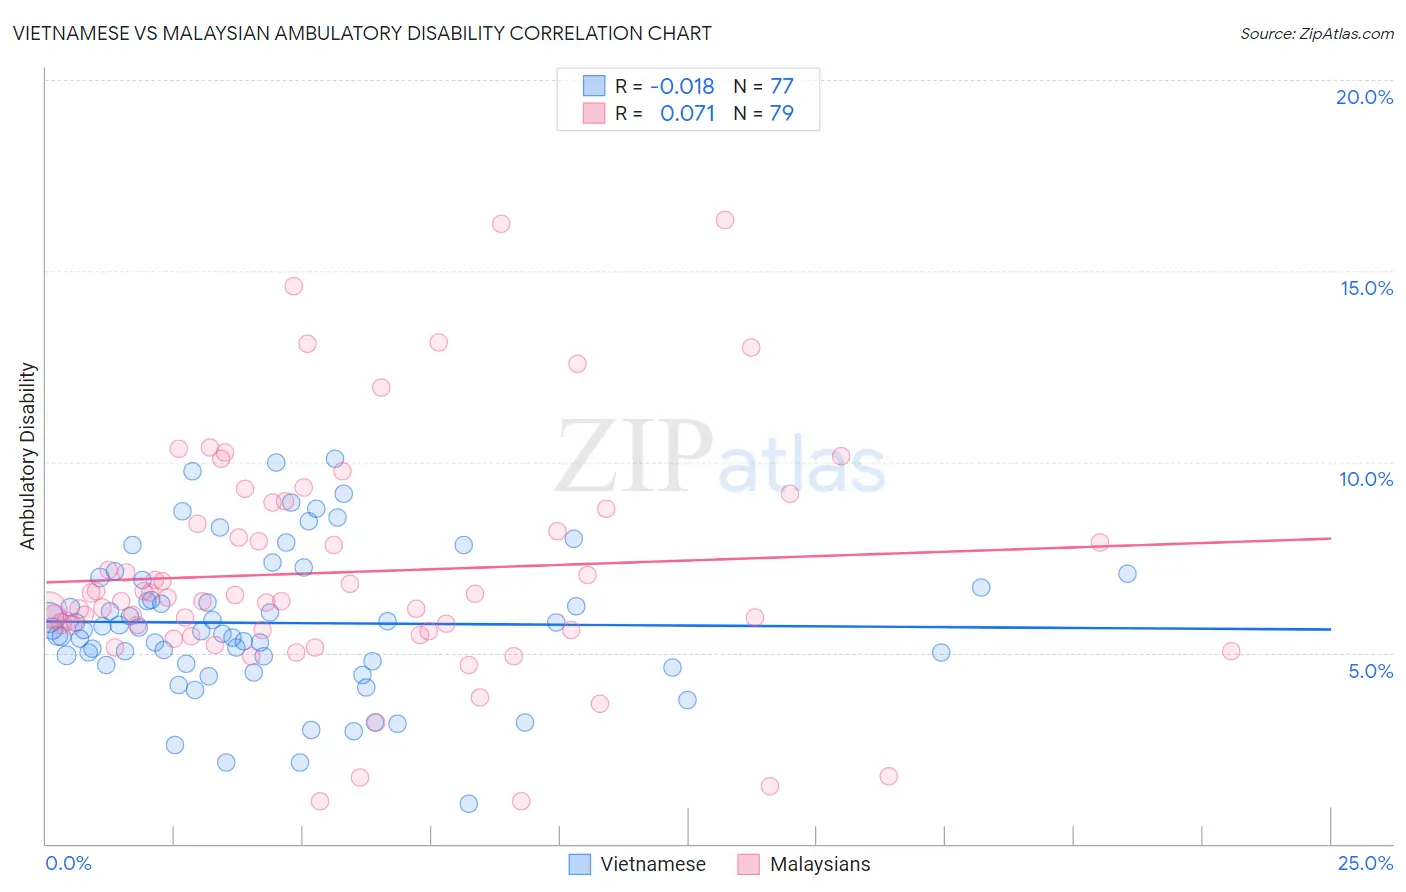
Vietnamese vs Malaysian Ambulatory Disability Correlation Chart
The statistical analysis conducted on geographies consisting of 170,721,676 people shows no correlation between the proportion of Vietnamese and percentage of population with ambulatory disability in the United States with a correlation coefficient (R) of -0.018 and weighted average of 6.1%. Similarly, the statistical analysis conducted on geographies consisting of 226,050,790 people shows a slight positive correlation between the proportion of Malaysians and percentage of population with ambulatory disability in the United States with a correlation coefficient (R) of 0.071 and weighted average of 6.2%, a difference of 1.1%.
Ambulatory Disability Correlation Summary
| Measurement | Vietnamese | Malaysian |
| Minimum | 1.1% | 1.1% |
| Maximum | 10.1% | 16.3% |
| Range | 9.0% | 15.2% |
| Mean | 5.8% | 7.1% |
| Median | 5.6% | 6.4% |
| Interquartile 25% (IQ1) | 4.7% | 5.6% |
| Interquartile 75% (IQ3) | 6.9% | 8.8% |
| Interquartile Range (IQR) | 2.2% | 3.2% |
| Standard Deviation (Sample) | 1.9% | 3.1% |
| Standard Deviation (Population) | 1.9% | 3.1% |
Similar Demographics by Ambulatory Disability
Demographics Similar to Vietnamese by Ambulatory Disability
In terms of ambulatory disability, the demographic groups most similar to Vietnamese are Immigrants from North America (6.1%, a difference of 0.090%), Immigrants from England (6.1%, a difference of 0.10%), Scandinavian (6.1%, a difference of 0.14%), Immigrants from Canada (6.1%, a difference of 0.15%), and Austrian (6.1%, a difference of 0.17%).
| Demographics | Rating | Rank | Ambulatory Disability |
| Ecuadorians | 60.5 /100 | #168 | Good 6.1% |
| Immigrants | Southern Europe | 58.1 /100 | #169 | Average 6.1% |
| Immigrants | Ecuador | 53.8 /100 | #170 | Average 6.1% |
| Moroccans | 52.6 /100 | #171 | Average 6.1% |
| Immigrants | Burma/Myanmar | 52.2 /100 | #172 | Average 6.1% |
| Croatians | 51.2 /100 | #173 | Average 6.1% |
| Immigrants | Canada | 50.0 /100 | #174 | Average 6.1% |
| Vietnamese | 47.2 /100 | #175 | Average 6.1% |
| Immigrants | North America | 45.6 /100 | #176 | Average 6.1% |
| Immigrants | England | 45.4 /100 | #177 | Average 6.1% |
| Scandinavians | 44.5 /100 | #178 | Average 6.1% |
| Austrians | 44.1 /100 | #179 | Average 6.1% |
| Immigrants | Nicaragua | 43.9 /100 | #180 | Average 6.1% |
| Swiss | 43.1 /100 | #181 | Average 6.1% |
| Serbians | 42.8 /100 | #182 | Average 6.1% |
Demographics Similar to Malaysians by Ambulatory Disability
In terms of ambulatory disability, the demographic groups most similar to Malaysians are Belgian (6.2%, a difference of 0.030%), Alaska Native (6.2%, a difference of 0.10%), Guatemalan (6.2%, a difference of 0.11%), Polish (6.2%, a difference of 0.12%), and Immigrants from Western Europe (6.2%, a difference of 0.21%).
| Demographics | Rating | Rank | Ambulatory Disability |
| Ukrainians | 34.0 /100 | #189 | Fair 6.2% |
| Immigrants | Western Africa | 33.4 /100 | #190 | Fair 6.2% |
| Immigrants | Guatemala | 31.9 /100 | #191 | Fair 6.2% |
| Immigrants | Western Europe | 31.6 /100 | #192 | Fair 6.2% |
| Guatemalans | 30.0 /100 | #193 | Fair 6.2% |
| Alaska Natives | 29.8 /100 | #194 | Fair 6.2% |
| Belgians | 28.6 /100 | #195 | Fair 6.2% |
| Malaysians | 28.2 /100 | #196 | Fair 6.2% |
| Poles | 26.3 /100 | #197 | Fair 6.2% |
| Immigrants | Bangladesh | 24.6 /100 | #198 | Fair 6.2% |
| Italians | 22.6 /100 | #199 | Fair 6.2% |
| Immigrants | Cambodia | 21.5 /100 | #200 | Fair 6.2% |
| Immigrants | Central America | 20.1 /100 | #201 | Fair 6.2% |
| Albanians | 19.7 /100 | #202 | Poor 6.2% |
| Immigrants | Ukraine | 18.4 /100 | #203 | Poor 6.2% |