Immigrants from Albania vs Puget Sound Salish Male Disability
COMPARE
Immigrants from Albania
Puget Sound Salish
Male Disability
Male Disability Comparison
Immigrants from Albania
Puget Sound Salish
11.0%
MALE DISABILITY
74.4/ 100
METRIC RATING
152nd/ 347
METRIC RANK
13.5%
MALE DISABILITY
0.0/ 100
METRIC RATING
313th/ 347
METRIC RANK
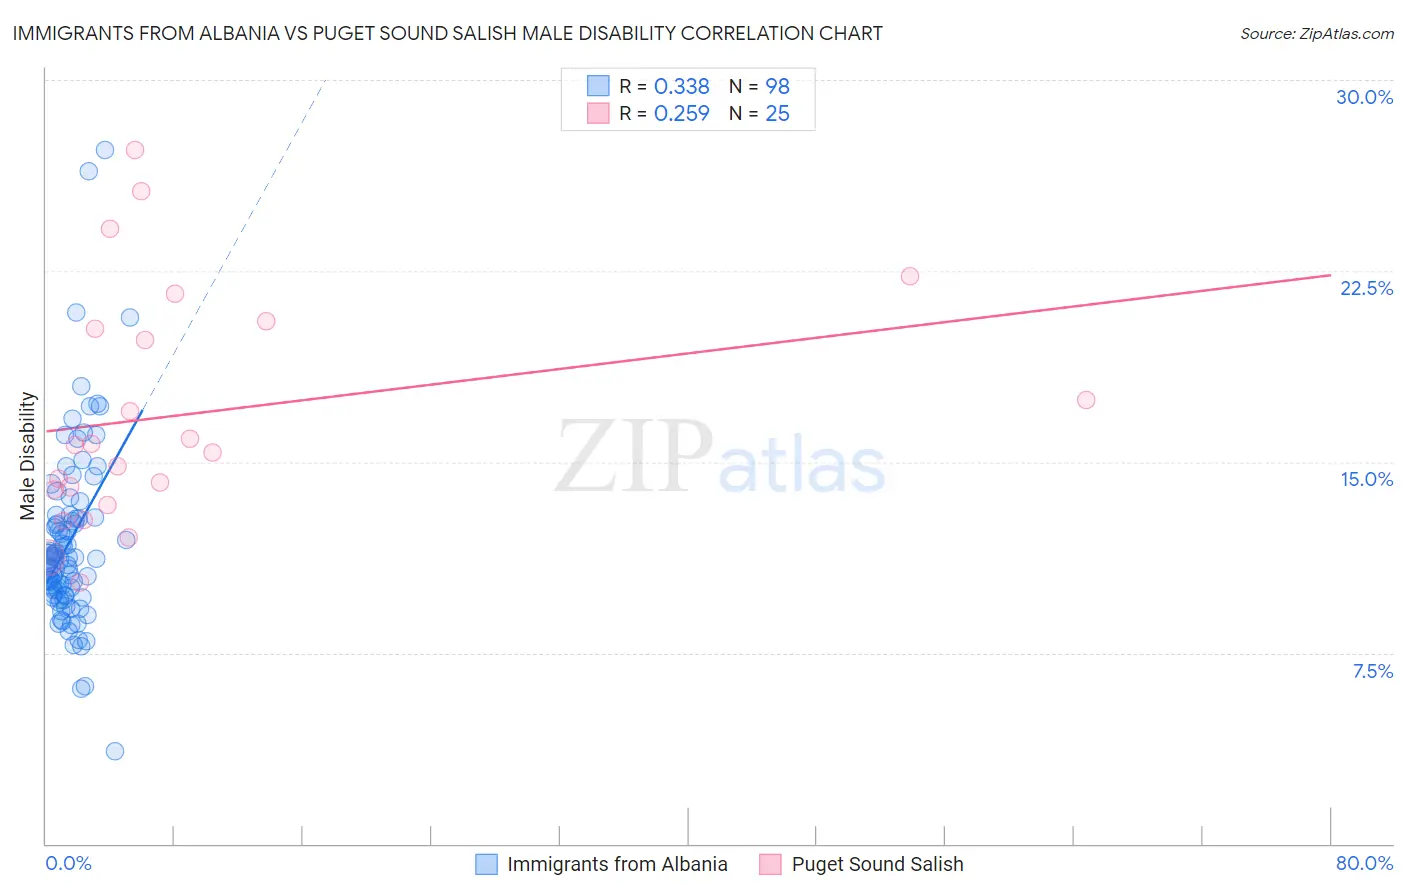
Immigrants from Albania vs Puget Sound Salish Male Disability Correlation Chart
The statistical analysis conducted on geographies consisting of 119,394,562 people shows a mild positive correlation between the proportion of Immigrants from Albania and percentage of males with a disability in the United States with a correlation coefficient (R) of 0.338 and weighted average of 11.0%. Similarly, the statistical analysis conducted on geographies consisting of 46,152,398 people shows a weak positive correlation between the proportion of Puget Sound Salish and percentage of males with a disability in the United States with a correlation coefficient (R) of 0.259 and weighted average of 13.5%, a difference of 22.5%.
Male Disability Correlation Summary
| Measurement | Immigrants from Albania | Puget Sound Salish |
| Minimum | 3.6% | 10.3% |
| Maximum | 27.2% | 27.3% |
| Range | 23.6% | 17.0% |
| Mean | 11.9% | 16.9% |
| Median | 11.2% | 15.6% |
| Interquartile 25% (IQ1) | 9.8% | 13.6% |
| Interquartile 75% (IQ3) | 12.8% | 20.4% |
| Interquartile Range (IQR) | 3.0% | 6.8% |
| Standard Deviation (Sample) | 3.6% | 4.6% |
| Standard Deviation (Population) | 3.6% | 4.5% |
Similar Demographics by Male Disability
Demographics Similar to Immigrants from Albania by Male Disability
In terms of male disability, the demographic groups most similar to Immigrants from Albania are Cuban (11.0%, a difference of 0.030%), Immigrants from Guatemala (11.0%, a difference of 0.050%), Immigrants from Northern Europe (11.1%, a difference of 0.090%), Immigrants from Moldova (11.1%, a difference of 0.11%), and Immigrants from Denmark (11.0%, a difference of 0.15%).
| Demographics | Rating | Rank | Male Disability |
| Costa Ricans | 78.0 /100 | #145 | Good 11.0% |
| Koreans | 77.5 /100 | #146 | Good 11.0% |
| Immigrants | Croatia | 77.3 /100 | #147 | Good 11.0% |
| Sudanese | 77.1 /100 | #148 | Good 11.0% |
| Immigrants | Denmark | 76.4 /100 | #149 | Good 11.0% |
| Immigrants | Guatemala | 75.1 /100 | #150 | Good 11.0% |
| Cubans | 74.9 /100 | #151 | Good 11.0% |
| Immigrants | Albania | 74.4 /100 | #152 | Good 11.0% |
| Immigrants | Northern Europe | 73.2 /100 | #153 | Good 11.1% |
| Immigrants | Moldova | 72.8 /100 | #154 | Good 11.1% |
| Immigrants | Middle Africa | 70.9 /100 | #155 | Good 11.1% |
| Russians | 69.8 /100 | #156 | Good 11.1% |
| Immigrants | Western Africa | 69.2 /100 | #157 | Good 11.1% |
| Latvians | 68.1 /100 | #158 | Good 11.1% |
| Guatemalans | 67.2 /100 | #159 | Good 11.1% |
Demographics Similar to Puget Sound Salish by Male Disability
In terms of male disability, the demographic groups most similar to Puget Sound Salish are Yakama (13.5%, a difference of 0.020%), Aleut (13.5%, a difference of 0.060%), Iroquois (13.6%, a difference of 0.22%), Alaska Native (13.6%, a difference of 0.27%), and Delaware (13.5%, a difference of 0.57%).
| Demographics | Rating | Rank | Male Disability |
| Spanish Americans | 0.0 /100 | #306 | Tragic 13.3% |
| Arapaho | 0.0 /100 | #307 | Tragic 13.3% |
| French American Indians | 0.0 /100 | #308 | Tragic 13.4% |
| Blackfeet | 0.0 /100 | #309 | Tragic 13.4% |
| Immigrants | Azores | 0.0 /100 | #310 | Tragic 13.4% |
| Delaware | 0.0 /100 | #311 | Tragic 13.5% |
| Yakama | 0.0 /100 | #312 | Tragic 13.5% |
| Puget Sound Salish | 0.0 /100 | #313 | Tragic 13.5% |
| Aleuts | 0.0 /100 | #314 | Tragic 13.5% |
| Iroquois | 0.0 /100 | #315 | Tragic 13.6% |
| Alaska Natives | 0.0 /100 | #316 | Tragic 13.6% |
| Paiute | 0.0 /100 | #317 | Tragic 13.7% |
| Cree | 0.0 /100 | #318 | Tragic 13.7% |
| Americans | 0.0 /100 | #319 | Tragic 13.8% |
| Tlingit-Haida | 0.0 /100 | #320 | Tragic 13.8% |