Japanese vs Puget Sound Salish Male Disability
COMPARE
Japanese
Puget Sound Salish
Male Disability
Male Disability Comparison
Japanese
Puget Sound Salish
11.7%
MALE DISABILITY
3.1/ 100
METRIC RATING
224th/ 347
METRIC RANK
13.5%
MALE DISABILITY
0.0/ 100
METRIC RATING
313th/ 347
METRIC RANK
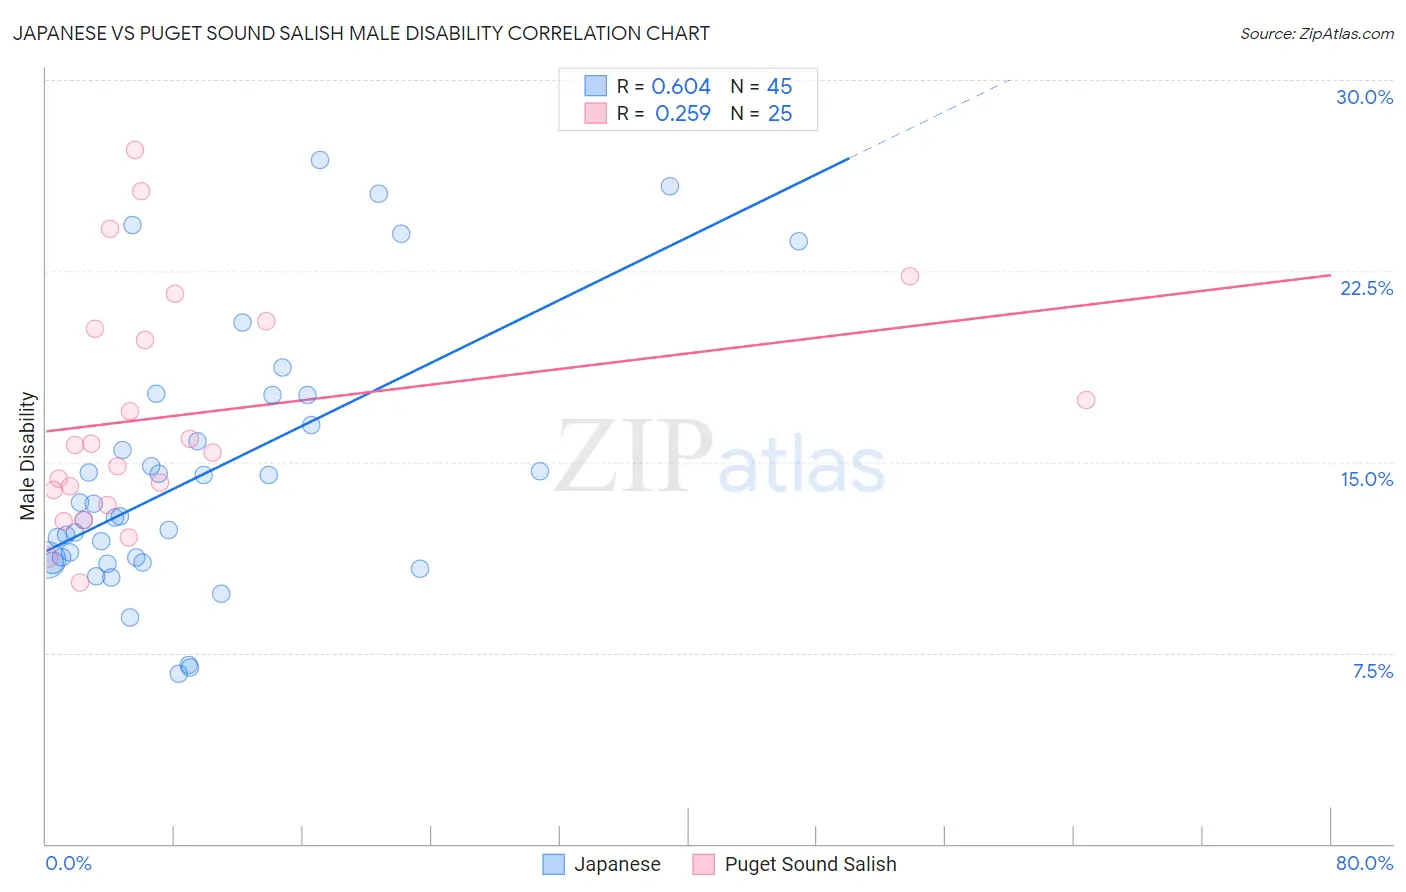
Japanese vs Puget Sound Salish Male Disability Correlation Chart
The statistical analysis conducted on geographies consisting of 249,159,975 people shows a significant positive correlation between the proportion of Japanese and percentage of males with a disability in the United States with a correlation coefficient (R) of 0.604 and weighted average of 11.7%. Similarly, the statistical analysis conducted on geographies consisting of 46,152,398 people shows a weak positive correlation between the proportion of Puget Sound Salish and percentage of males with a disability in the United States with a correlation coefficient (R) of 0.259 and weighted average of 13.5%, a difference of 15.2%.
Male Disability Correlation Summary
| Measurement | Japanese | Puget Sound Salish |
| Minimum | 6.7% | 10.3% |
| Maximum | 26.9% | 27.3% |
| Range | 20.2% | 17.0% |
| Mean | 14.5% | 16.9% |
| Median | 12.9% | 15.6% |
| Interquartile 25% (IQ1) | 11.1% | 13.6% |
| Interquartile 75% (IQ3) | 17.0% | 20.4% |
| Interquartile Range (IQR) | 5.9% | 6.8% |
| Standard Deviation (Sample) | 5.1% | 4.6% |
| Standard Deviation (Population) | 5.1% | 4.5% |
Similar Demographics by Male Disability
Demographics Similar to Japanese by Male Disability
In terms of male disability, the demographic groups most similar to Japanese are Liberian (11.8%, a difference of 0.010%), Immigrants from Bahamas (11.7%, a difference of 0.020%), Alsatian (11.7%, a difference of 0.11%), Subsaharan African (11.8%, a difference of 0.13%), and Immigrants from Congo (11.7%, a difference of 0.26%).
| Demographics | Rating | Rank | Male Disability |
| Immigrants | Dominica | 4.6 /100 | #217 | Tragic 11.7% |
| Immigrants | England | 4.0 /100 | #218 | Tragic 11.7% |
| Panamanians | 3.8 /100 | #219 | Tragic 11.7% |
| Immigrants | Western Europe | 3.8 /100 | #220 | Tragic 11.7% |
| Immigrants | Congo | 3.7 /100 | #221 | Tragic 11.7% |
| Alsatians | 3.3 /100 | #222 | Tragic 11.7% |
| Immigrants | Bahamas | 3.2 /100 | #223 | Tragic 11.7% |
| Japanese | 3.1 /100 | #224 | Tragic 11.7% |
| Liberians | 3.1 /100 | #225 | Tragic 11.8% |
| Sub-Saharan Africans | 2.8 /100 | #226 | Tragic 11.8% |
| Austrians | 2.5 /100 | #227 | Tragic 11.8% |
| Hispanics or Latinos | 2.3 /100 | #228 | Tragic 11.8% |
| Bermudans | 2.3 /100 | #229 | Tragic 11.8% |
| Croatians | 2.1 /100 | #230 | Tragic 11.8% |
| Dominicans | 1.8 /100 | #231 | Tragic 11.8% |
Demographics Similar to Puget Sound Salish by Male Disability
In terms of male disability, the demographic groups most similar to Puget Sound Salish are Yakama (13.5%, a difference of 0.020%), Aleut (13.5%, a difference of 0.060%), Iroquois (13.6%, a difference of 0.22%), Alaska Native (13.6%, a difference of 0.27%), and Delaware (13.5%, a difference of 0.57%).
| Demographics | Rating | Rank | Male Disability |
| Spanish Americans | 0.0 /100 | #306 | Tragic 13.3% |
| Arapaho | 0.0 /100 | #307 | Tragic 13.3% |
| French American Indians | 0.0 /100 | #308 | Tragic 13.4% |
| Blackfeet | 0.0 /100 | #309 | Tragic 13.4% |
| Immigrants | Azores | 0.0 /100 | #310 | Tragic 13.4% |
| Delaware | 0.0 /100 | #311 | Tragic 13.5% |
| Yakama | 0.0 /100 | #312 | Tragic 13.5% |
| Puget Sound Salish | 0.0 /100 | #313 | Tragic 13.5% |
| Aleuts | 0.0 /100 | #314 | Tragic 13.5% |
| Iroquois | 0.0 /100 | #315 | Tragic 13.6% |
| Alaska Natives | 0.0 /100 | #316 | Tragic 13.6% |
| Paiute | 0.0 /100 | #317 | Tragic 13.7% |
| Cree | 0.0 /100 | #318 | Tragic 13.7% |
| Americans | 0.0 /100 | #319 | Tragic 13.8% |
| Tlingit-Haida | 0.0 /100 | #320 | Tragic 13.8% |