Sri Lankan vs Immigrants from Portugal Vision Disability
COMPARE
Sri Lankan
Immigrants from Portugal
Vision Disability
Vision Disability Comparison
Sri Lankans
Immigrants from Portugal
2.1%
VISION DISABILITY
94.8/ 100
METRIC RATING
102nd/ 347
METRIC RANK
2.3%
VISION DISABILITY
1.4/ 100
METRIC RATING
237th/ 347
METRIC RANK
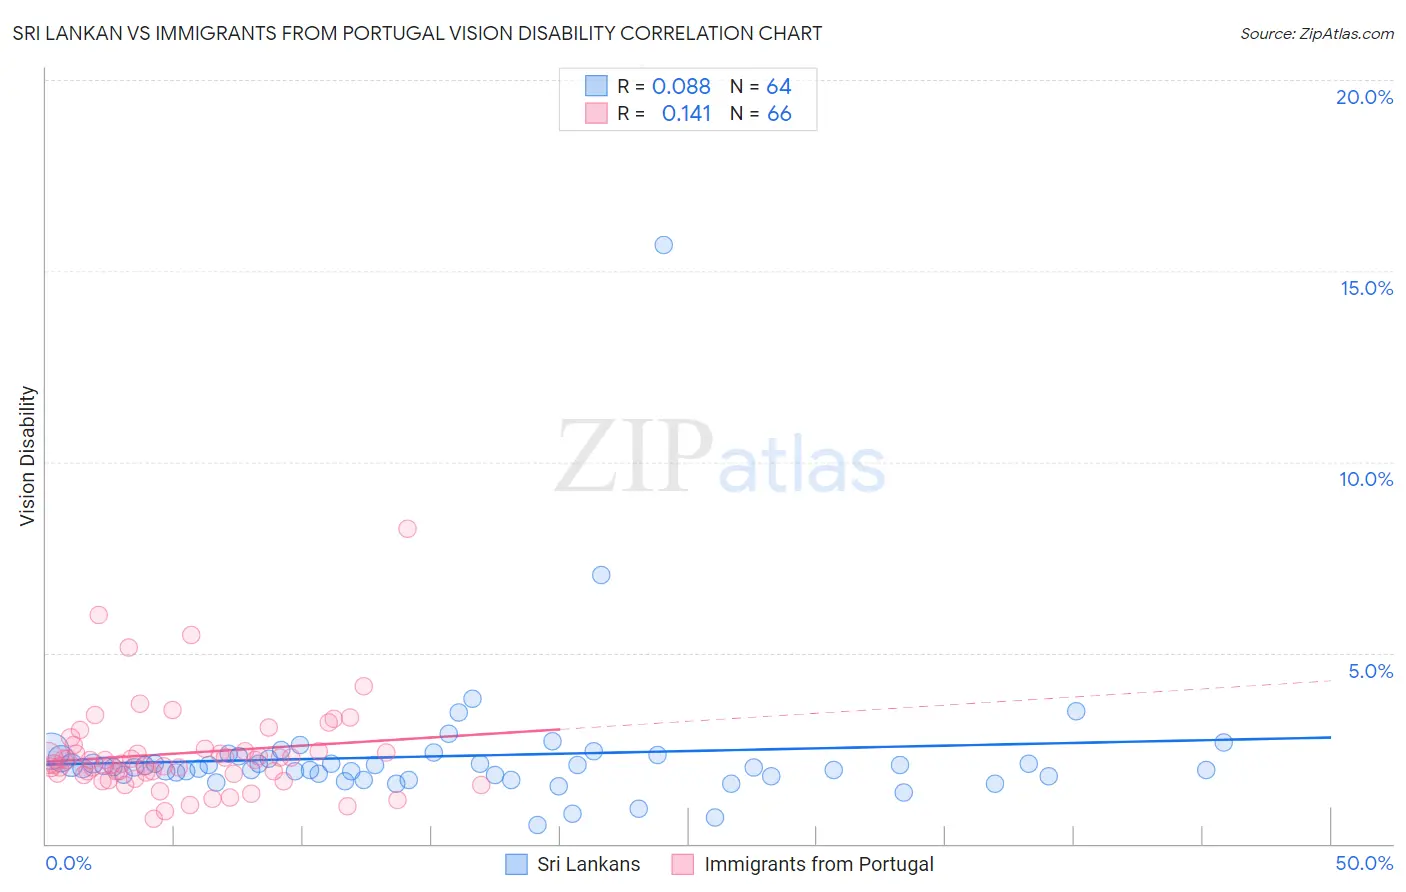
Sri Lankan vs Immigrants from Portugal Vision Disability Correlation Chart
The statistical analysis conducted on geographies consisting of 440,158,739 people shows a slight positive correlation between the proportion of Sri Lankans and percentage of population with vision disability in the United States with a correlation coefficient (R) of 0.088 and weighted average of 2.1%. Similarly, the statistical analysis conducted on geographies consisting of 174,661,842 people shows a poor positive correlation between the proportion of Immigrants from Portugal and percentage of population with vision disability in the United States with a correlation coefficient (R) of 0.141 and weighted average of 2.3%, a difference of 11.9%.
Vision Disability Correlation Summary
| Measurement | Sri Lankan | Immigrants from Portugal |
| Minimum | 0.49% | 0.66% |
| Maximum | 15.7% | 8.3% |
| Range | 15.2% | 7.6% |
| Mean | 2.3% | 2.4% |
| Median | 2.0% | 2.1% |
| Interquartile 25% (IQ1) | 1.8% | 1.8% |
| Interquartile 75% (IQ3) | 2.3% | 2.4% |
| Interquartile Range (IQR) | 0.48% | 0.59% |
| Standard Deviation (Sample) | 1.9% | 1.2% |
| Standard Deviation (Population) | 1.9% | 1.2% |
Similar Demographics by Vision Disability
Demographics Similar to Sri Lankans by Vision Disability
In terms of vision disability, the demographic groups most similar to Sri Lankans are Albanian (2.1%, a difference of 0.030%), Greek (2.1%, a difference of 0.11%), Immigrants from Austria (2.1%, a difference of 0.14%), Estonian (2.1%, a difference of 0.15%), and Immigrants from Italy (2.1%, a difference of 0.15%).
| Demographics | Rating | Rank | Vision Disability |
| Australians | 95.9 /100 | #95 | Exceptional 2.1% |
| Romanians | 95.7 /100 | #96 | Exceptional 2.1% |
| Immigrants | Afghanistan | 95.6 /100 | #97 | Exceptional 2.1% |
| Immigrants | South Africa | 95.4 /100 | #98 | Exceptional 2.1% |
| Estonians | 95.3 /100 | #99 | Exceptional 2.1% |
| Greeks | 95.1 /100 | #100 | Exceptional 2.1% |
| Albanians | 94.9 /100 | #101 | Exceptional 2.1% |
| Sri Lankans | 94.8 /100 | #102 | Exceptional 2.1% |
| Immigrants | Austria | 94.4 /100 | #103 | Exceptional 2.1% |
| Immigrants | Italy | 94.4 /100 | #104 | Exceptional 2.1% |
| Carpatho Rusyns | 94.3 /100 | #105 | Exceptional 2.1% |
| Swedes | 94.2 /100 | #106 | Exceptional 2.1% |
| Danes | 94.2 /100 | #107 | Exceptional 2.1% |
| Koreans | 94.1 /100 | #108 | Exceptional 2.1% |
| Chileans | 94.0 /100 | #109 | Exceptional 2.1% |
Demographics Similar to Immigrants from Portugal by Vision Disability
In terms of vision disability, the demographic groups most similar to Immigrants from Portugal are Immigrants from Congo (2.3%, a difference of 0.050%), Marshallese (2.3%, a difference of 0.14%), Scottish (2.3%, a difference of 0.21%), Immigrants from Cambodia (2.3%, a difference of 0.27%), and English (2.3%, a difference of 0.29%).
| Demographics | Rating | Rank | Vision Disability |
| Nicaraguans | 2.2 /100 | #230 | Tragic 2.3% |
| Immigrants | Ecuador | 2.0 /100 | #231 | Tragic 2.3% |
| German Russians | 1.8 /100 | #232 | Tragic 2.3% |
| Central Americans | 1.8 /100 | #233 | Tragic 2.3% |
| Scottish | 1.6 /100 | #234 | Tragic 2.3% |
| Marshallese | 1.5 /100 | #235 | Tragic 2.3% |
| Immigrants | Congo | 1.4 /100 | #236 | Tragic 2.3% |
| Immigrants | Portugal | 1.4 /100 | #237 | Tragic 2.3% |
| Immigrants | Cambodia | 1.1 /100 | #238 | Tragic 2.3% |
| English | 1.1 /100 | #239 | Tragic 2.3% |
| Panamanians | 0.9 /100 | #240 | Tragic 2.3% |
| Malaysians | 0.9 /100 | #241 | Tragic 2.3% |
| Immigrants | Panama | 0.8 /100 | #242 | Tragic 2.3% |
| Immigrants | Nicaragua | 0.6 /100 | #243 | Tragic 2.3% |
| Immigrants | West Indies | 0.6 /100 | #244 | Tragic 2.3% |