Japanese vs Immigrants from Portugal Vision Disability
COMPARE
Japanese
Immigrants from Portugal
Vision Disability
Vision Disability Comparison
Japanese
Immigrants from Portugal
2.4%
VISION DISABILITY
0.3/ 100
METRIC RATING
253rd/ 347
METRIC RANK
2.3%
VISION DISABILITY
1.4/ 100
METRIC RATING
237th/ 347
METRIC RANK
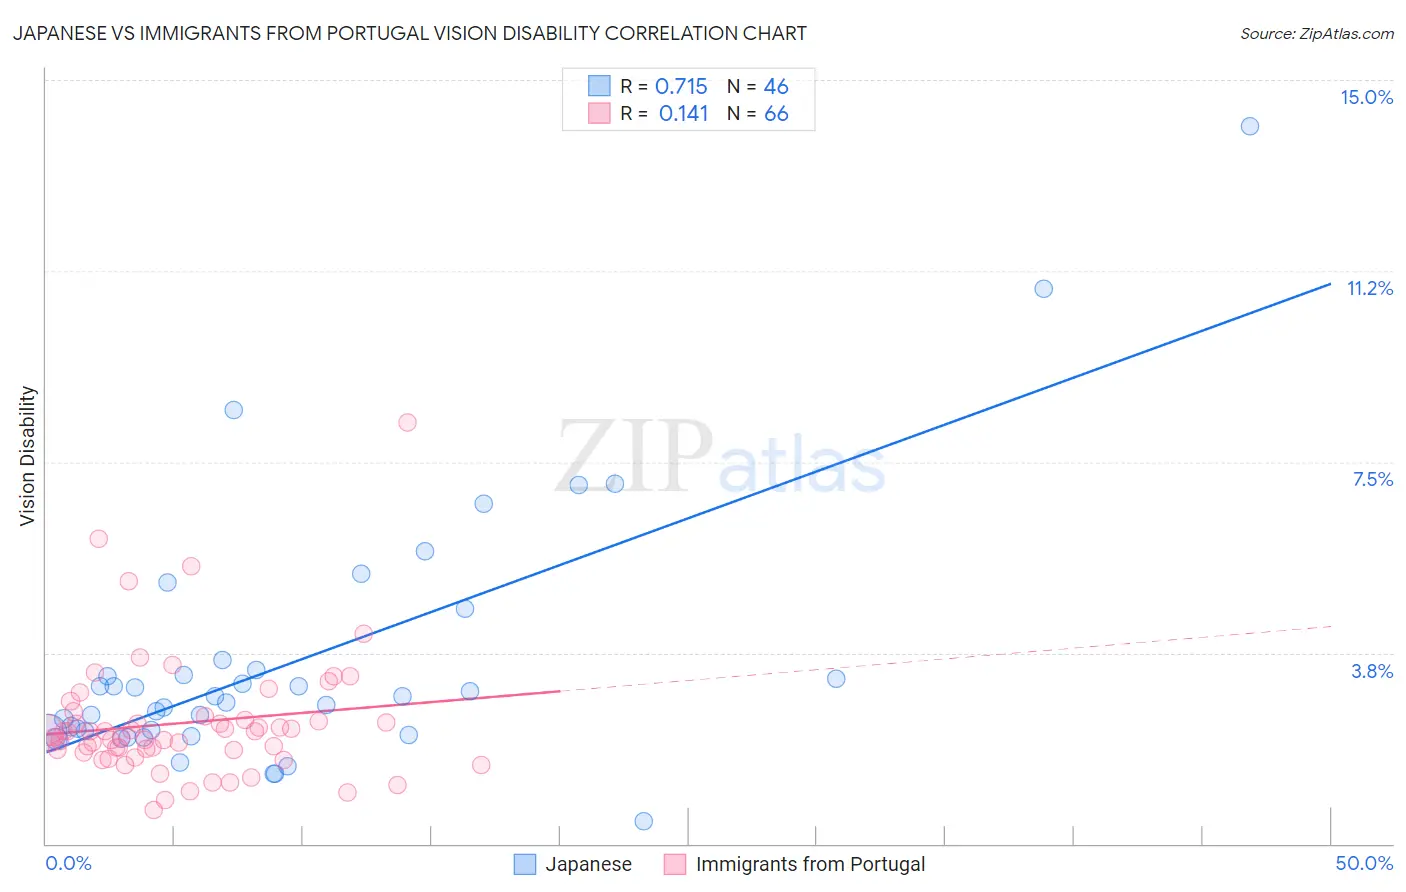
Japanese vs Immigrants from Portugal Vision Disability Correlation Chart
The statistical analysis conducted on geographies consisting of 249,077,012 people shows a strong positive correlation between the proportion of Japanese and percentage of population with vision disability in the United States with a correlation coefficient (R) of 0.715 and weighted average of 2.4%. Similarly, the statistical analysis conducted on geographies consisting of 174,661,842 people shows a poor positive correlation between the proportion of Immigrants from Portugal and percentage of population with vision disability in the United States with a correlation coefficient (R) of 0.141 and weighted average of 2.3%, a difference of 2.1%.
Vision Disability Correlation Summary
| Measurement | Japanese | Immigrants from Portugal |
| Minimum | 0.43% | 0.66% |
| Maximum | 14.1% | 8.3% |
| Range | 13.7% | 7.6% |
| Mean | 3.6% | 2.4% |
| Median | 2.8% | 2.1% |
| Interquartile 25% (IQ1) | 2.2% | 1.8% |
| Interquartile 75% (IQ3) | 3.4% | 2.4% |
| Interquartile Range (IQR) | 1.2% | 0.59% |
| Standard Deviation (Sample) | 2.6% | 1.2% |
| Standard Deviation (Population) | 2.5% | 1.2% |
Demographics Similar to Japanese and Immigrants from Portugal by Vision Disability
In terms of vision disability, the demographic groups most similar to Japanese are Immigrants from Micronesia (2.4%, a difference of 0.070%), Haitian (2.4%, a difference of 0.28%), Immigrants from Guatemala (2.4%, a difference of 0.31%), Immigrants from Laos (2.4%, a difference of 0.39%), and Bangladeshi (2.3%, a difference of 0.50%). Similarly, the demographic groups most similar to Immigrants from Portugal are Immigrants from Congo (2.3%, a difference of 0.050%), Marshallese (2.3%, a difference of 0.14%), Immigrants from Cambodia (2.3%, a difference of 0.27%), English (2.3%, a difference of 0.29%), and Panamanian (2.3%, a difference of 0.54%).
| Demographics | Rating | Rank | Vision Disability |
| Marshallese | 1.5 /100 | #235 | Tragic 2.3% |
| Immigrants | Congo | 1.4 /100 | #236 | Tragic 2.3% |
| Immigrants | Portugal | 1.4 /100 | #237 | Tragic 2.3% |
| Immigrants | Cambodia | 1.1 /100 | #238 | Tragic 2.3% |
| English | 1.1 /100 | #239 | Tragic 2.3% |
| Panamanians | 0.9 /100 | #240 | Tragic 2.3% |
| Malaysians | 0.9 /100 | #241 | Tragic 2.3% |
| Immigrants | Panama | 0.8 /100 | #242 | Tragic 2.3% |
| Immigrants | Nicaragua | 0.6 /100 | #243 | Tragic 2.3% |
| Immigrants | West Indies | 0.6 /100 | #244 | Tragic 2.3% |
| Alsatians | 0.6 /100 | #245 | Tragic 2.3% |
| French | 0.5 /100 | #246 | Tragic 2.3% |
| Guatemalans | 0.5 /100 | #247 | Tragic 2.3% |
| Sub-Saharan Africans | 0.5 /100 | #248 | Tragic 2.3% |
| Liberians | 0.5 /100 | #249 | Tragic 2.3% |
| Bangladeshis | 0.5 /100 | #250 | Tragic 2.3% |
| Immigrants | Laos | 0.4 /100 | #251 | Tragic 2.4% |
| Immigrants | Micronesia | 0.3 /100 | #252 | Tragic 2.4% |
| Japanese | 0.3 /100 | #253 | Tragic 2.4% |
| Haitians | 0.3 /100 | #254 | Tragic 2.4% |
| Immigrants | Guatemala | 0.3 /100 | #255 | Tragic 2.4% |