Ute vs Immigrants from Portugal 1 or more Vehicles in Household
COMPARE
Ute
Immigrants from Portugal
1 or more Vehicles in Household
1 or more Vehicles in Household Comparison
Ute
Immigrants from Portugal
88.7%
1 OR MORE VEHICLES IN HOUSEHOLD
5.6/ 100
METRIC RATING
227th/ 347
METRIC RANK
88.3%
1 OR MORE VEHICLES IN HOUSEHOLD
2.0/ 100
METRIC RATING
244th/ 347
METRIC RANK
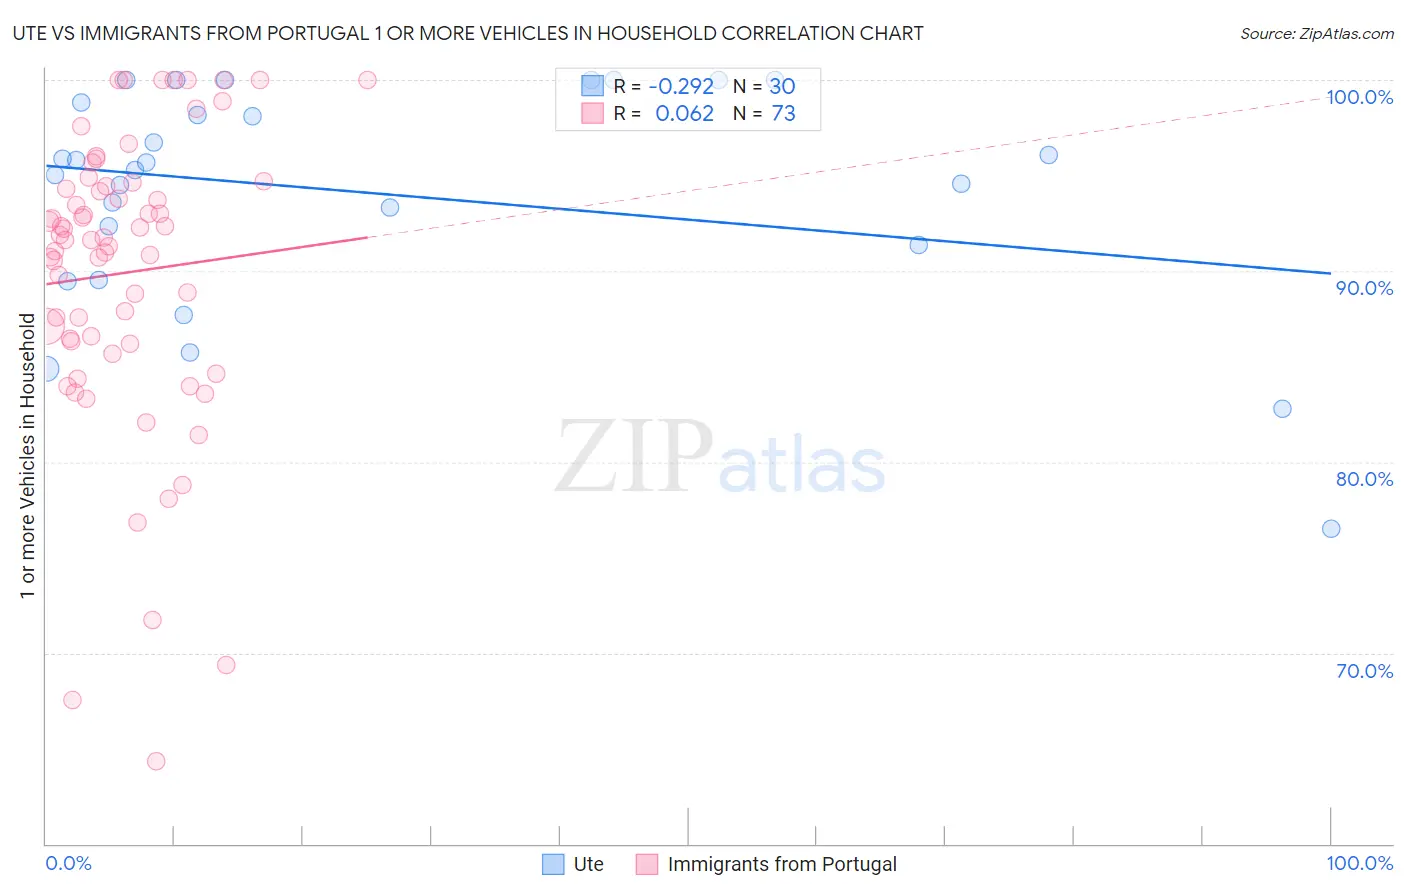
Ute vs Immigrants from Portugal 1 or more Vehicles in Household Correlation Chart
The statistical analysis conducted on geographies consisting of 55,668,072 people shows a weak negative correlation between the proportion of Ute and percentage of households with 1 or more vehicles available in the United States with a correlation coefficient (R) of -0.292 and weighted average of 88.7%. Similarly, the statistical analysis conducted on geographies consisting of 174,753,622 people shows a slight positive correlation between the proportion of Immigrants from Portugal and percentage of households with 1 or more vehicles available in the United States with a correlation coefficient (R) of 0.062 and weighted average of 88.3%, a difference of 0.42%.
1 or more Vehicles in Household Correlation Summary
| Measurement | Ute | Immigrants from Portugal |
| Minimum | 76.5% | 64.3% |
| Maximum | 100.0% | 100.0% |
| Range | 23.5% | 35.7% |
| Mean | 94.1% | 89.9% |
| Median | 95.5% | 91.7% |
| Interquartile 25% (IQ1) | 91.4% | 86.3% |
| Interquartile 75% (IQ3) | 98.8% | 94.5% |
| Interquartile Range (IQR) | 7.5% | 8.3% |
| Standard Deviation (Sample) | 5.9% | 7.7% |
| Standard Deviation (Population) | 5.8% | 7.6% |
Demographics Similar to Ute and Immigrants from Portugal by 1 or more Vehicles in Household
In terms of 1 or more vehicles in household, the demographic groups most similar to Ute are Cheyenne (88.7%, a difference of 0.0%), Immigrants from Norway (88.7%, a difference of 0.010%), Immigrants from Romania (88.7%, a difference of 0.020%), Cree (88.7%, a difference of 0.030%), and Immigrants from Sierra Leone (88.7%, a difference of 0.030%). Similarly, the demographic groups most similar to Immigrants from Portugal are Immigrants from Czechoslovakia (88.3%, a difference of 0.010%), Immigrants from Belgium (88.4%, a difference of 0.020%), Turkish (88.4%, a difference of 0.080%), Taiwanese (88.4%, a difference of 0.11%), and Eastern European (88.5%, a difference of 0.16%).
| Demographics | Rating | Rank | 1 or more Vehicles in Household |
| Cree | 6.0 /100 | #225 | Tragic 88.7% |
| Cheyenne | 5.7 /100 | #226 | Tragic 88.7% |
| Ute | 5.6 /100 | #227 | Tragic 88.7% |
| Immigrants | Norway | 5.5 /100 | #228 | Tragic 88.7% |
| Immigrants | Romania | 5.4 /100 | #229 | Tragic 88.7% |
| Immigrants | Sierra Leone | 5.2 /100 | #230 | Tragic 88.7% |
| Russians | 5.0 /100 | #231 | Tragic 88.7% |
| Immigrants | Japan | 4.9 /100 | #232 | Tragic 88.7% |
| Houma | 4.8 /100 | #233 | Tragic 88.6% |
| Immigrants | Peru | 4.7 /100 | #234 | Tragic 88.6% |
| Paiute | 4.6 /100 | #235 | Tragic 88.6% |
| Immigrants | Pakistan | 4.5 /100 | #236 | Tragic 88.6% |
| Immigrants | Turkey | 4.4 /100 | #237 | Tragic 88.6% |
| Immigrants | Somalia | 4.2 /100 | #238 | Tragic 88.6% |
| Kiowa | 3.8 /100 | #239 | Tragic 88.6% |
| Eastern Europeans | 3.0 /100 | #240 | Tragic 88.5% |
| Taiwanese | 2.6 /100 | #241 | Tragic 88.4% |
| Turks | 2.5 /100 | #242 | Tragic 88.4% |
| Immigrants | Belgium | 2.1 /100 | #243 | Tragic 88.4% |
| Immigrants | Portugal | 2.0 /100 | #244 | Tragic 88.3% |
| Immigrants | Czechoslovakia | 1.9 /100 | #245 | Tragic 88.3% |