Immigrants from Sweden vs Guatemalan Ambulatory Disability
COMPARE
Immigrants from Sweden
Guatemalan
Ambulatory Disability
Ambulatory Disability Comparison
Immigrants from Sweden
Guatemalans
5.6%
AMBULATORY DISABILITY
99.9/ 100
METRIC RATING
45th/ 347
METRIC RANK
6.2%
AMBULATORY DISABILITY
30.0/ 100
METRIC RATING
193rd/ 347
METRIC RANK
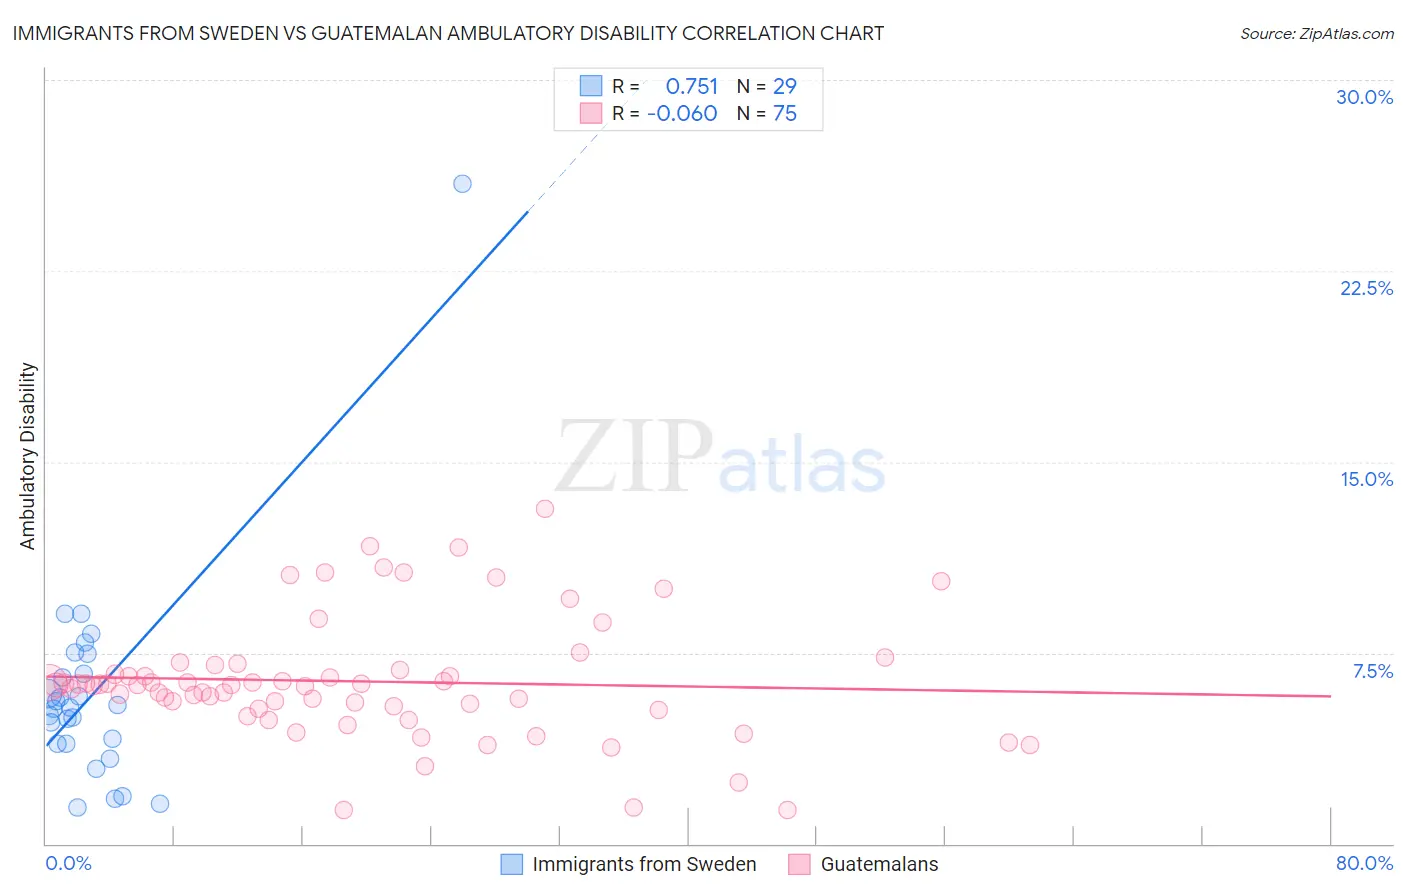
Immigrants from Sweden vs Guatemalan Ambulatory Disability Correlation Chart
The statistical analysis conducted on geographies consisting of 164,722,765 people shows a strong positive correlation between the proportion of Immigrants from Sweden and percentage of population with ambulatory disability in the United States with a correlation coefficient (R) of 0.751 and weighted average of 5.6%. Similarly, the statistical analysis conducted on geographies consisting of 409,382,771 people shows a slight negative correlation between the proportion of Guatemalans and percentage of population with ambulatory disability in the United States with a correlation coefficient (R) of -0.060 and weighted average of 6.2%, a difference of 11.4%.
Ambulatory Disability Correlation Summary
| Measurement | Immigrants from Sweden | Guatemalan |
| Minimum | 1.4% | 1.3% |
| Maximum | 25.9% | 13.2% |
| Range | 24.5% | 11.9% |
| Mean | 5.9% | 6.4% |
| Median | 5.4% | 6.2% |
| Interquartile 25% (IQ1) | 3.9% | 5.3% |
| Interquartile 75% (IQ3) | 7.1% | 6.8% |
| Interquartile Range (IQR) | 3.1% | 1.5% |
| Standard Deviation (Sample) | 4.4% | 2.4% |
| Standard Deviation (Population) | 4.3% | 2.3% |
Similar Demographics by Ambulatory Disability
Demographics Similar to Immigrants from Sweden by Ambulatory Disability
In terms of ambulatory disability, the demographic groups most similar to Immigrants from Sweden are Egyptian (5.6%, a difference of 0.010%), Immigrants from Japan (5.6%, a difference of 0.010%), Immigrants from Argentina (5.6%, a difference of 0.020%), Immigrants from Indonesia (5.5%, a difference of 0.17%), and Bulgarian (5.6%, a difference of 0.22%).
| Demographics | Rating | Rank | Ambulatory Disability |
| Cypriots | 100.0 /100 | #38 | Exceptional 5.5% |
| Immigrants | Eritrea | 100.0 /100 | #39 | Exceptional 5.5% |
| Venezuelans | 99.9 /100 | #40 | Exceptional 5.5% |
| Mongolians | 99.9 /100 | #41 | Exceptional 5.5% |
| Argentineans | 99.9 /100 | #42 | Exceptional 5.5% |
| Paraguayans | 99.9 /100 | #43 | Exceptional 5.5% |
| Immigrants | Indonesia | 99.9 /100 | #44 | Exceptional 5.5% |
| Immigrants | Sweden | 99.9 /100 | #45 | Exceptional 5.6% |
| Egyptians | 99.9 /100 | #46 | Exceptional 5.6% |
| Immigrants | Japan | 99.9 /100 | #47 | Exceptional 5.6% |
| Immigrants | Argentina | 99.9 /100 | #48 | Exceptional 5.6% |
| Bulgarians | 99.9 /100 | #49 | Exceptional 5.6% |
| Luxembourgers | 99.9 /100 | #50 | Exceptional 5.6% |
| Taiwanese | 99.8 /100 | #51 | Exceptional 5.6% |
| Jordanians | 99.8 /100 | #52 | Exceptional 5.6% |
Demographics Similar to Guatemalans by Ambulatory Disability
In terms of ambulatory disability, the demographic groups most similar to Guatemalans are Alaska Native (6.2%, a difference of 0.010%), Belgian (6.2%, a difference of 0.080%), Immigrants from Western Europe (6.2%, a difference of 0.10%), Malaysian (6.2%, a difference of 0.11%), and Immigrants from Guatemala (6.2%, a difference of 0.12%).
| Demographics | Rating | Rank | Ambulatory Disability |
| Europeans | 36.2 /100 | #186 | Fair 6.2% |
| Carpatho Rusyns | 35.3 /100 | #187 | Fair 6.2% |
| British | 34.3 /100 | #188 | Fair 6.2% |
| Ukrainians | 34.0 /100 | #189 | Fair 6.2% |
| Immigrants | Western Africa | 33.4 /100 | #190 | Fair 6.2% |
| Immigrants | Guatemala | 31.9 /100 | #191 | Fair 6.2% |
| Immigrants | Western Europe | 31.6 /100 | #192 | Fair 6.2% |
| Guatemalans | 30.0 /100 | #193 | Fair 6.2% |
| Alaska Natives | 29.8 /100 | #194 | Fair 6.2% |
| Belgians | 28.6 /100 | #195 | Fair 6.2% |
| Malaysians | 28.2 /100 | #196 | Fair 6.2% |
| Poles | 26.3 /100 | #197 | Fair 6.2% |
| Immigrants | Bangladesh | 24.6 /100 | #198 | Fair 6.2% |
| Italians | 22.6 /100 | #199 | Fair 6.2% |
| Immigrants | Cambodia | 21.5 /100 | #200 | Fair 6.2% |