Ute vs Fijian Disability Age 18 to 34
COMPARE
Ute
Fijian
Disability Age 18 to 34
Disability Age 18 to 34 Comparison
Ute
Fijians
7.0%
DISABILITY AGE 18 TO 34
3.8/ 100
METRIC RATING
231st/ 347
METRIC RANK
7.2%
DISABILITY AGE 18 TO 34
0.6/ 100
METRIC RATING
250th/ 347
METRIC RANK
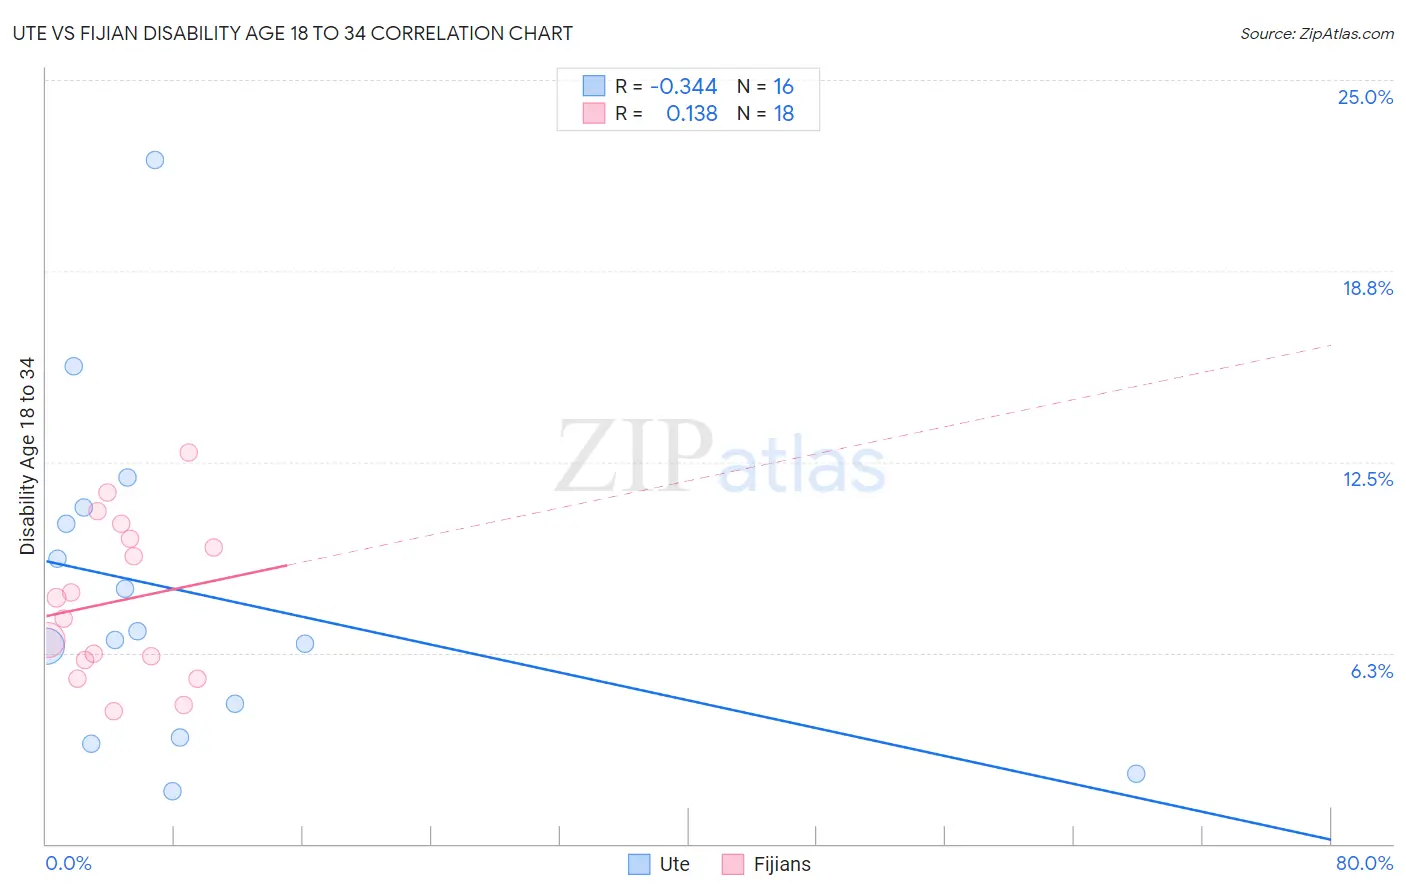
Ute vs Fijian Disability Age 18 to 34 Correlation Chart
The statistical analysis conducted on geographies consisting of 55,639,467 people shows a mild negative correlation between the proportion of Ute and percentage of population with a disability between the ages 18 and 35 in the United States with a correlation coefficient (R) of -0.344 and weighted average of 7.0%. Similarly, the statistical analysis conducted on geographies consisting of 55,913,538 people shows a poor positive correlation between the proportion of Fijians and percentage of population with a disability between the ages 18 and 35 in the United States with a correlation coefficient (R) of 0.138 and weighted average of 7.2%, a difference of 3.1%.
Disability Age 18 to 34 Correlation Summary
| Measurement | Ute | Fijian |
| Minimum | 1.7% | 4.3% |
| Maximum | 22.4% | 12.8% |
| Range | 20.7% | 8.5% |
| Mean | 8.2% | 7.9% |
| Median | 6.8% | 7.7% |
| Interquartile 25% (IQ1) | 4.0% | 6.0% |
| Interquartile 75% (IQ3) | 10.7% | 10.0% |
| Interquartile Range (IQR) | 6.7% | 4.0% |
| Standard Deviation (Sample) | 5.4% | 2.5% |
| Standard Deviation (Population) | 5.2% | 2.5% |
Demographics Similar to Ute and Fijians by Disability Age 18 to 34
In terms of disability age 18 to 34, the demographic groups most similar to Ute are Immigrants from North America (7.0%, a difference of 0.020%), Samoan (7.0%, a difference of 0.30%), New Zealander (7.0%, a difference of 0.56%), Alsatian (7.0%, a difference of 0.99%), and Subsaharan African (7.1%, a difference of 1.4%). Similarly, the demographic groups most similar to Fijians are Malaysian (7.2%, a difference of 0.29%), Guamanian/Chamorro (7.2%, a difference of 0.39%), Yugoslavian (7.2%, a difference of 0.43%), Immigrants from Liberia (7.1%, a difference of 0.58%), and Hungarian (7.1%, a difference of 0.60%).
| Demographics | Rating | Rank | Disability Age 18 to 34 |
| Immigrants | North America | 3.9 /100 | #230 | Tragic 7.0% |
| Ute | 3.8 /100 | #231 | Tragic 7.0% |
| Samoans | 3.2 /100 | #232 | Tragic 7.0% |
| New Zealanders | 2.7 /100 | #233 | Tragic 7.0% |
| Alsatians | 2.1 /100 | #234 | Tragic 7.0% |
| Sub-Saharan Africans | 1.7 /100 | #235 | Tragic 7.1% |
| Liberians | 1.5 /100 | #236 | Tragic 7.1% |
| Austrians | 1.3 /100 | #237 | Tragic 7.1% |
| Marshallese | 1.3 /100 | #238 | Tragic 7.1% |
| Italians | 1.2 /100 | #239 | Tragic 7.1% |
| Arapaho | 1.1 /100 | #240 | Tragic 7.1% |
| Nepalese | 1.1 /100 | #241 | Tragic 7.1% |
| Immigrants | Congo | 1.1 /100 | #242 | Tragic 7.1% |
| Icelanders | 1.0 /100 | #243 | Tragic 7.1% |
| Immigrants | Zaire | 0.9 /100 | #244 | Tragic 7.1% |
| Hungarians | 0.9 /100 | #245 | Tragic 7.1% |
| Immigrants | Liberia | 0.8 /100 | #246 | Tragic 7.1% |
| Yugoslavians | 0.8 /100 | #247 | Tragic 7.2% |
| Guamanians/Chamorros | 0.8 /100 | #248 | Tragic 7.2% |
| Malaysians | 0.7 /100 | #249 | Tragic 7.2% |
| Fijians | 0.6 /100 | #250 | Tragic 7.2% |