Ute vs Fijian 7th Grade
COMPARE
Ute
Fijian
7th Grade
7th Grade Comparison
Ute
Fijians
96.1%
7TH GRADE
55.8/ 100
METRIC RATING
169th/ 347
METRIC RANK
94.7%
7TH GRADE
0.0/ 100
METRIC RATING
293rd/ 347
METRIC RANK
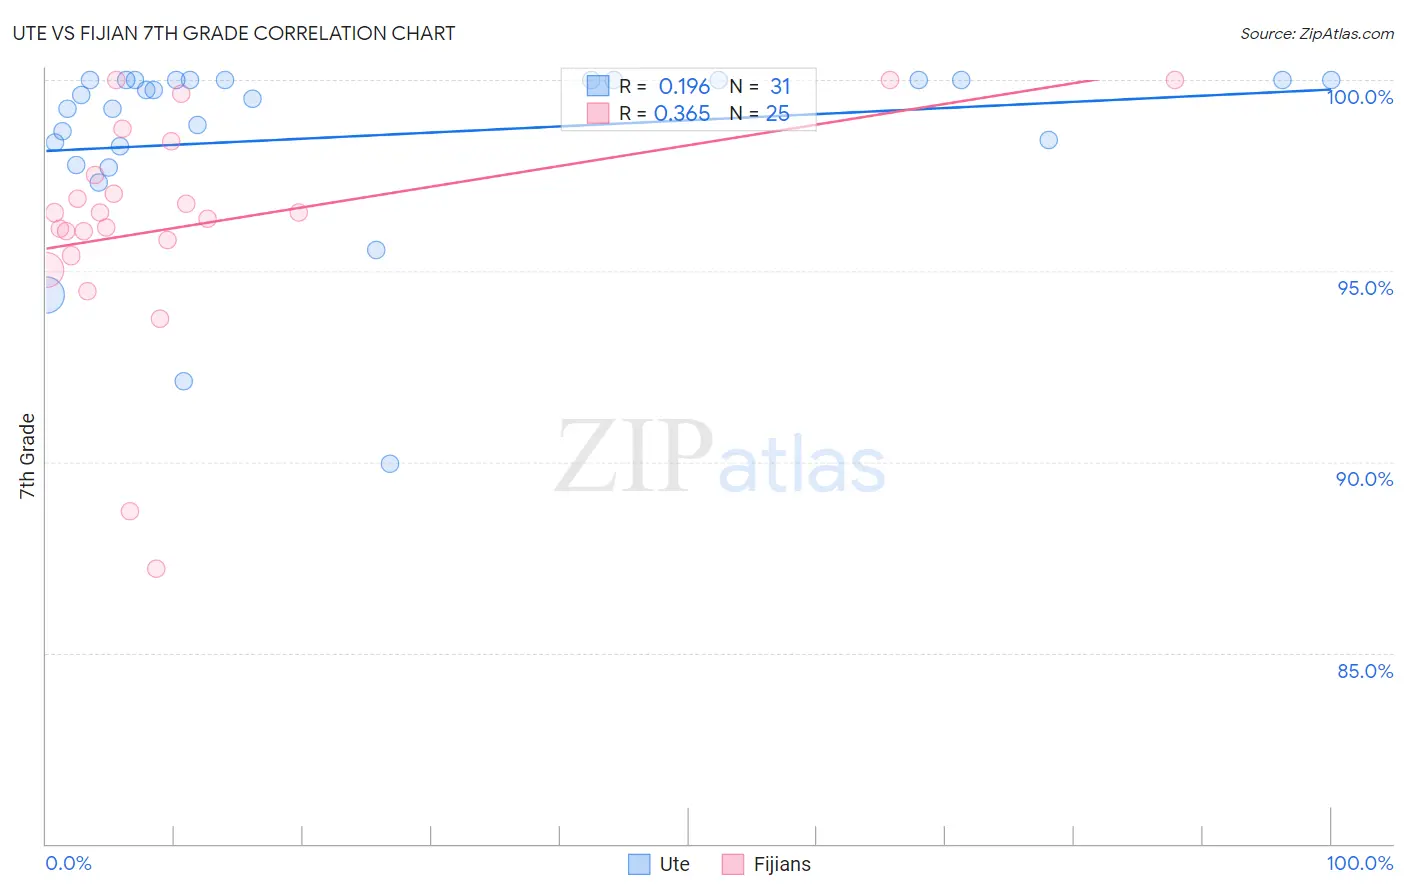
Ute vs Fijian 7th Grade Correlation Chart
The statistical analysis conducted on geographies consisting of 55,668,539 people shows a poor positive correlation between the proportion of Ute and percentage of population with at least 7th grade education in the United States with a correlation coefficient (R) of 0.196 and weighted average of 96.1%. Similarly, the statistical analysis conducted on geographies consisting of 55,948,842 people shows a mild positive correlation between the proportion of Fijians and percentage of population with at least 7th grade education in the United States with a correlation coefficient (R) of 0.365 and weighted average of 94.7%, a difference of 1.4%.
7th Grade Correlation Summary
| Measurement | Ute | Fijian |
| Minimum | 89.9% | 87.2% |
| Maximum | 100.0% | 100.0% |
| Range | 10.1% | 12.8% |
| Mean | 98.5% | 96.2% |
| Median | 99.6% | 96.5% |
| Interquartile 25% (IQ1) | 98.3% | 95.6% |
| Interquartile 75% (IQ3) | 100.0% | 97.9% |
| Interquartile Range (IQR) | 1.7% | 2.3% |
| Standard Deviation (Sample) | 2.4% | 3.0% |
| Standard Deviation (Population) | 2.4% | 3.0% |
Similar Demographics by 7th Grade
Demographics Similar to Ute by 7th Grade
In terms of 7th grade, the demographic groups most similar to Ute are Immigrants from Ukraine (96.1%, a difference of 0.0%), Egyptian (96.1%, a difference of 0.010%), Immigrants from Poland (96.1%, a difference of 0.020%), Immigrants from Kazakhstan (96.1%, a difference of 0.030%), and Immigrants from Sri Lanka (96.1%, a difference of 0.030%).
| Demographics | Rating | Rank | 7th Grade |
| Pima | 64.3 /100 | #162 | Good 96.1% |
| Spaniards | 62.6 /100 | #163 | Good 96.1% |
| Immigrants | Italy | 62.1 /100 | #164 | Good 96.1% |
| Immigrants | Taiwan | 61.5 /100 | #165 | Good 96.1% |
| Immigrants | Kazakhstan | 61.0 /100 | #166 | Good 96.1% |
| Immigrants | Sri Lanka | 59.9 /100 | #167 | Average 96.1% |
| Immigrants | Poland | 59.0 /100 | #168 | Average 96.1% |
| Ute | 55.8 /100 | #169 | Average 96.1% |
| Immigrants | Ukraine | 55.0 /100 | #170 | Average 96.1% |
| Egyptians | 54.2 /100 | #171 | Average 96.1% |
| Venezuelans | 51.4 /100 | #172 | Average 96.0% |
| Immigrants | Albania | 50.4 /100 | #173 | Average 96.0% |
| Mongolians | 50.0 /100 | #174 | Average 96.0% |
| Blacks/African Americans | 49.5 /100 | #175 | Average 96.0% |
| Chileans | 49.3 /100 | #176 | Average 96.0% |
Demographics Similar to Fijians by 7th Grade
In terms of 7th grade, the demographic groups most similar to Fijians are Immigrants from West Indies (94.8%, a difference of 0.020%), Immigrants from Grenada (94.8%, a difference of 0.040%), Haitian (94.7%, a difference of 0.080%), Malaysian (94.8%, a difference of 0.090%), and Taiwanese (94.8%, a difference of 0.10%).
| Demographics | Rating | Rank | 7th Grade |
| Immigrants | Philippines | 0.0 /100 | #286 | Tragic 94.9% |
| Immigrants | Peru | 0.0 /100 | #287 | Tragic 94.9% |
| British West Indians | 0.0 /100 | #288 | Tragic 94.8% |
| Taiwanese | 0.0 /100 | #289 | Tragic 94.8% |
| Malaysians | 0.0 /100 | #290 | Tragic 94.8% |
| Immigrants | Grenada | 0.0 /100 | #291 | Tragic 94.8% |
| Immigrants | West Indies | 0.0 /100 | #292 | Tragic 94.8% |
| Fijians | 0.0 /100 | #293 | Tragic 94.7% |
| Haitians | 0.0 /100 | #294 | Tragic 94.7% |
| Yaqui | 0.0 /100 | #295 | Tragic 94.6% |
| Cubans | 0.0 /100 | #296 | Tragic 94.6% |
| Immigrants | South Eastern Asia | 0.0 /100 | #297 | Tragic 94.5% |
| Indonesians | 0.0 /100 | #298 | Tragic 94.5% |
| Bangladeshis | 0.0 /100 | #299 | Tragic 94.5% |
| Immigrants | Burma/Myanmar | 0.0 /100 | #300 | Tragic 94.5% |