Ute vs Fijian Master's Degree
COMPARE
Ute
Fijian
Master's Degree
Master's Degree Comparison
Ute
Fijians
11.7%
MASTER'S DEGREE
0.1/ 100
METRIC RATING
290th/ 347
METRIC RANK
10.3%
MASTER'S DEGREE
0.0/ 100
METRIC RATING
330th/ 347
METRIC RANK
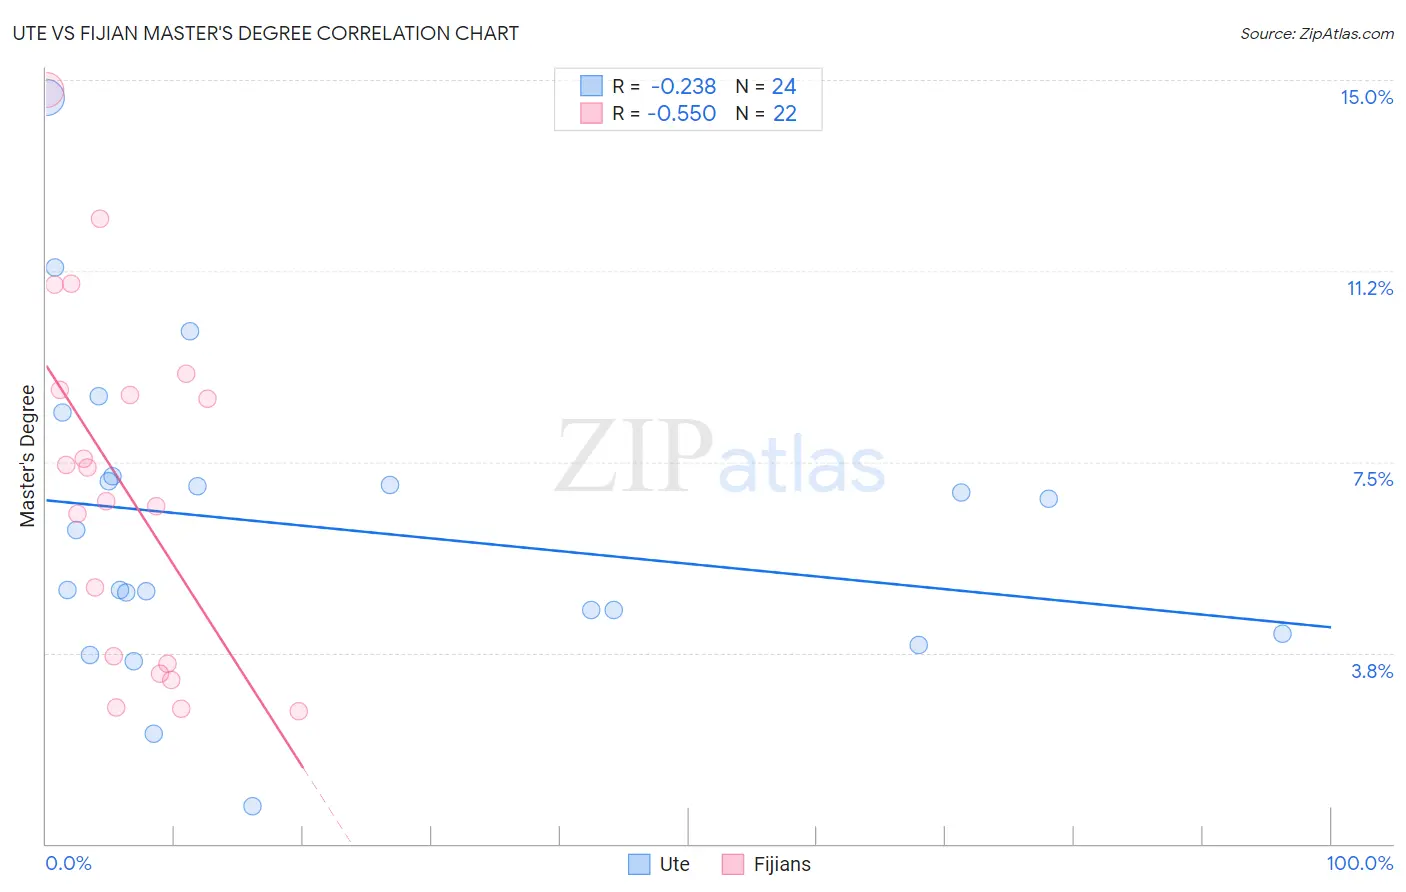
Ute vs Fijian Master's Degree Correlation Chart
The statistical analysis conducted on geographies consisting of 55,657,479 people shows a weak negative correlation between the proportion of Ute and percentage of population with at least master's degree education in the United States with a correlation coefficient (R) of -0.238 and weighted average of 11.7%. Similarly, the statistical analysis conducted on geographies consisting of 55,944,571 people shows a substantial negative correlation between the proportion of Fijians and percentage of population with at least master's degree education in the United States with a correlation coefficient (R) of -0.550 and weighted average of 10.3%, a difference of 13.9%.
Master's Degree Correlation Summary
| Measurement | Ute | Fijian |
| Minimum | 0.74% | 2.6% |
| Maximum | 14.6% | 14.8% |
| Range | 13.9% | 12.2% |
| Mean | 6.2% | 7.0% |
| Median | 5.6% | 7.1% |
| Interquartile 25% (IQ1) | 4.4% | 3.5% |
| Interquartile 75% (IQ3) | 7.2% | 8.9% |
| Interquartile Range (IQR) | 2.8% | 5.4% |
| Standard Deviation (Sample) | 3.0% | 3.4% |
| Standard Deviation (Population) | 2.9% | 3.4% |
Similar Demographics by Master's Degree
Demographics Similar to Ute by Master's Degree
In terms of master's degree, the demographic groups most similar to Ute are Guatemalan (11.7%, a difference of 0.24%), Immigrants from Honduras (11.8%, a difference of 0.32%), Immigrants from Haiti (11.8%, a difference of 0.49%), Colville (11.6%, a difference of 0.67%), and Aleut (11.8%, a difference of 0.69%).
| Demographics | Rating | Rank | Master's Degree |
| Hondurans | 0.2 /100 | #283 | Tragic 11.9% |
| Ottawa | 0.2 /100 | #284 | Tragic 11.9% |
| Immigrants | Nicaragua | 0.2 /100 | #285 | Tragic 11.8% |
| Aleuts | 0.1 /100 | #286 | Tragic 11.8% |
| Immigrants | Haiti | 0.1 /100 | #287 | Tragic 11.8% |
| Immigrants | Honduras | 0.1 /100 | #288 | Tragic 11.8% |
| Guatemalans | 0.1 /100 | #289 | Tragic 11.7% |
| Ute | 0.1 /100 | #290 | Tragic 11.7% |
| Colville | 0.1 /100 | #291 | Tragic 11.6% |
| Immigrants | Guatemala | 0.1 /100 | #292 | Tragic 11.6% |
| Alaska Natives | 0.1 /100 | #293 | Tragic 11.6% |
| Hawaiians | 0.1 /100 | #294 | Tragic 11.6% |
| Marshallese | 0.1 /100 | #295 | Tragic 11.6% |
| Alaskan Athabascans | 0.1 /100 | #296 | Tragic 11.6% |
| Immigrants | Yemen | 0.1 /100 | #297 | Tragic 11.6% |
Demographics Similar to Fijians by Master's Degree
In terms of master's degree, the demographic groups most similar to Fijians are Pueblo (10.3%, a difference of 0.16%), Immigrants from the Azores (10.2%, a difference of 0.63%), Menominee (10.2%, a difference of 1.0%), Nepalese (10.5%, a difference of 1.7%), and Bangladeshi (10.5%, a difference of 1.8%).
| Demographics | Rating | Rank | Master's Degree |
| Crow | 0.0 /100 | #323 | Tragic 10.6% |
| Dutch West Indians | 0.0 /100 | #324 | Tragic 10.6% |
| Inupiat | 0.0 /100 | #325 | Tragic 10.5% |
| Creek | 0.0 /100 | #326 | Tragic 10.5% |
| Paiute | 0.0 /100 | #327 | Tragic 10.5% |
| Bangladeshis | 0.0 /100 | #328 | Tragic 10.5% |
| Nepalese | 0.0 /100 | #329 | Tragic 10.5% |
| Fijians | 0.0 /100 | #330 | Tragic 10.3% |
| Pueblo | 0.0 /100 | #331 | Tragic 10.3% |
| Immigrants | Azores | 0.0 /100 | #332 | Tragic 10.2% |
| Menominee | 0.0 /100 | #333 | Tragic 10.2% |
| Arapaho | 0.0 /100 | #334 | Tragic 10.0% |
| Immigrants | Central America | 0.0 /100 | #335 | Tragic 10.0% |
| Natives/Alaskans | 0.0 /100 | #336 | Tragic 9.9% |
| Mexicans | 0.0 /100 | #337 | Tragic 9.7% |