Ute vs Immigrants from Western Asia Disability Age 18 to 34
COMPARE
Ute
Immigrants from Western Asia
Disability Age 18 to 34
Disability Age 18 to 34 Comparison
Ute
Immigrants from Western Asia
7.0%
DISABILITY AGE 18 TO 34
3.8/ 100
METRIC RATING
231st/ 347
METRIC RANK
6.1%
DISABILITY AGE 18 TO 34
98.9/ 100
METRIC RATING
76th/ 347
METRIC RANK
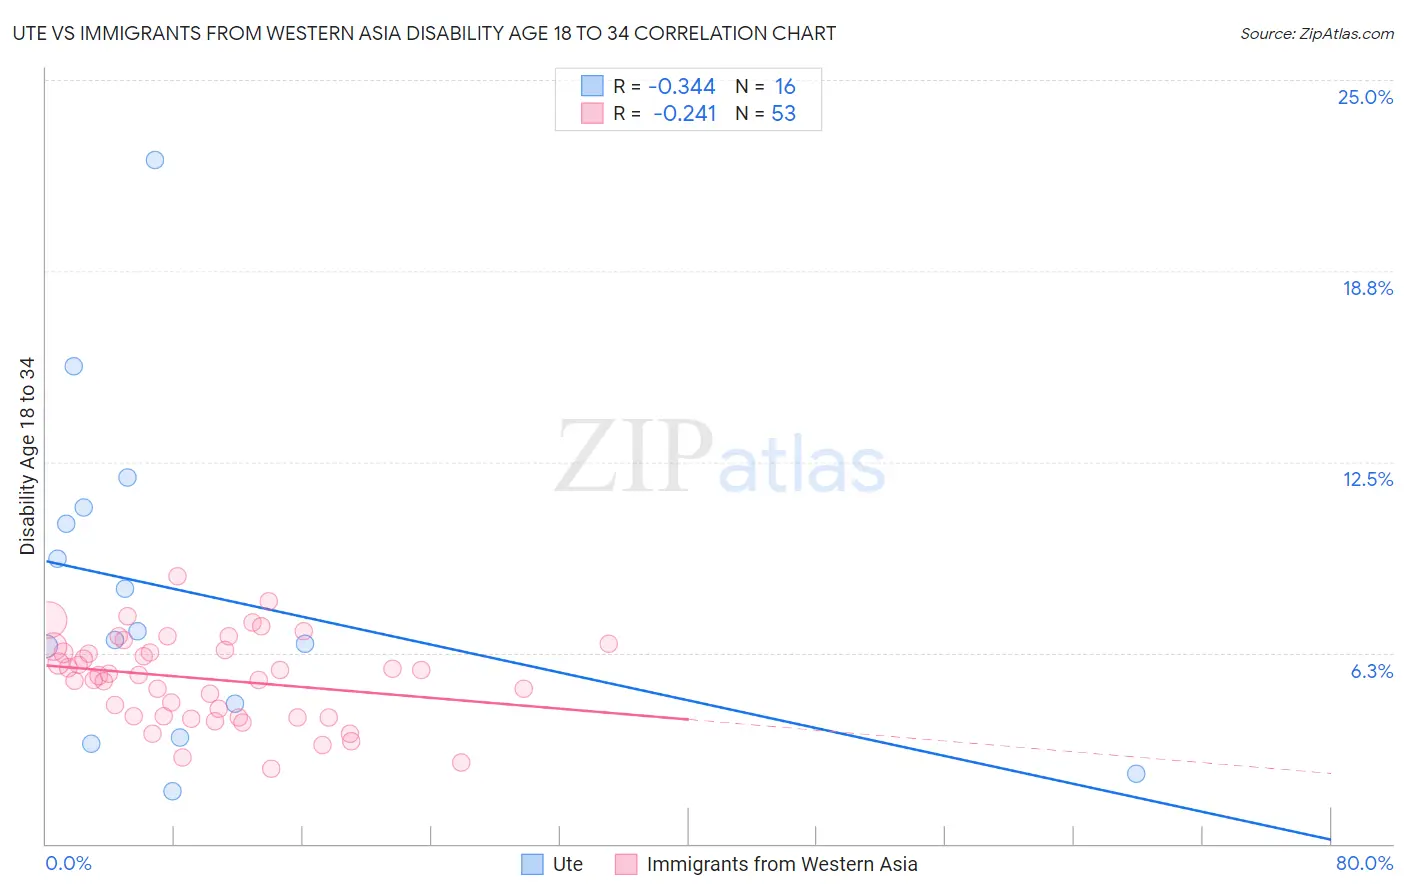
Ute vs Immigrants from Western Asia Disability Age 18 to 34 Correlation Chart
The statistical analysis conducted on geographies consisting of 55,639,467 people shows a mild negative correlation between the proportion of Ute and percentage of population with a disability between the ages 18 and 35 in the United States with a correlation coefficient (R) of -0.344 and weighted average of 7.0%. Similarly, the statistical analysis conducted on geographies consisting of 403,567,862 people shows a weak negative correlation between the proportion of Immigrants from Western Asia and percentage of population with a disability between the ages 18 and 35 in the United States with a correlation coefficient (R) of -0.241 and weighted average of 6.1%, a difference of 14.6%.
Disability Age 18 to 34 Correlation Summary
| Measurement | Ute | Immigrants from Western Asia |
| Minimum | 1.7% | 2.5% |
| Maximum | 22.4% | 8.7% |
| Range | 20.7% | 6.3% |
| Mean | 8.2% | 5.4% |
| Median | 6.8% | 5.5% |
| Interquartile 25% (IQ1) | 4.0% | 4.1% |
| Interquartile 75% (IQ3) | 10.7% | 6.4% |
| Interquartile Range (IQR) | 6.7% | 2.2% |
| Standard Deviation (Sample) | 5.4% | 1.4% |
| Standard Deviation (Population) | 5.2% | 1.4% |
Similar Demographics by Disability Age 18 to 34
Demographics Similar to Ute by Disability Age 18 to 34
In terms of disability age 18 to 34, the demographic groups most similar to Ute are Immigrants from North America (7.0%, a difference of 0.020%), Lithuanian (7.0%, a difference of 0.11%), Immigrants from Yemen (7.0%, a difference of 0.14%), Immigrants from Canada (7.0%, a difference of 0.20%), and Ugandan (6.9%, a difference of 0.25%).
| Demographics | Rating | Rank | Disability Age 18 to 34 |
| Senegalese | 4.9 /100 | #224 | Tragic 6.9% |
| Central American Indians | 4.7 /100 | #225 | Tragic 6.9% |
| Ugandans | 4.4 /100 | #226 | Tragic 6.9% |
| Immigrants | Canada | 4.3 /100 | #227 | Tragic 7.0% |
| Immigrants | Yemen | 4.2 /100 | #228 | Tragic 7.0% |
| Lithuanians | 4.1 /100 | #229 | Tragic 7.0% |
| Immigrants | North America | 3.9 /100 | #230 | Tragic 7.0% |
| Ute | 3.8 /100 | #231 | Tragic 7.0% |
| Samoans | 3.2 /100 | #232 | Tragic 7.0% |
| New Zealanders | 2.7 /100 | #233 | Tragic 7.0% |
| Alsatians | 2.1 /100 | #234 | Tragic 7.0% |
| Sub-Saharan Africans | 1.7 /100 | #235 | Tragic 7.1% |
| Liberians | 1.5 /100 | #236 | Tragic 7.1% |
| Austrians | 1.3 /100 | #237 | Tragic 7.1% |
| Marshallese | 1.3 /100 | #238 | Tragic 7.1% |
Demographics Similar to Immigrants from Western Asia by Disability Age 18 to 34
In terms of disability age 18 to 34, the demographic groups most similar to Immigrants from Western Asia are Immigrants from Russia (6.1%, a difference of 0.10%), Assyrian/Chaldean/Syriac (6.1%, a difference of 0.10%), Immigrants from Turkey (6.1%, a difference of 0.28%), Afghan (6.1%, a difference of 0.40%), and Haitian (6.0%, a difference of 0.58%).
| Demographics | Rating | Rank | Disability Age 18 to 34 |
| Immigrants | West Indies | 99.4 /100 | #69 | Exceptional 6.0% |
| Immigrants | Greece | 99.4 /100 | #70 | Exceptional 6.0% |
| Immigrants | Japan | 99.3 /100 | #71 | Exceptional 6.0% |
| Immigrants | Lebanon | 99.2 /100 | #72 | Exceptional 6.0% |
| Cypriots | 99.2 /100 | #73 | Exceptional 6.0% |
| Haitians | 99.2 /100 | #74 | Exceptional 6.0% |
| Immigrants | Turkey | 99.1 /100 | #75 | Exceptional 6.1% |
| Immigrants | Western Asia | 98.9 /100 | #76 | Exceptional 6.1% |
| Immigrants | Russia | 98.9 /100 | #77 | Exceptional 6.1% |
| Assyrians/Chaldeans/Syriacs | 98.9 /100 | #78 | Exceptional 6.1% |
| Afghans | 98.7 /100 | #79 | Exceptional 6.1% |
| Immigrants | Chile | 98.5 /100 | #80 | Exceptional 6.1% |
| Immigrants | Australia | 98.5 /100 | #81 | Exceptional 6.1% |
| Immigrants | Northern Africa | 98.4 /100 | #82 | Exceptional 6.1% |
| Barbadians | 98.3 /100 | #83 | Exceptional 6.1% |