Ute vs Fijian In Labor Force | Age 30-34
COMPARE
Ute
Fijian
In Labor Force | Age 30-34
In Labor Force | Age 30-34 Comparison
Ute
Fijians
78.9%
IN LABOR FORCE | AGE 30-34
0.0/ 100
METRIC RATING
340th/ 347
METRIC RANK
83.4%
IN LABOR FORCE | AGE 30-34
0.0/ 100
METRIC RATING
278th/ 347
METRIC RANK
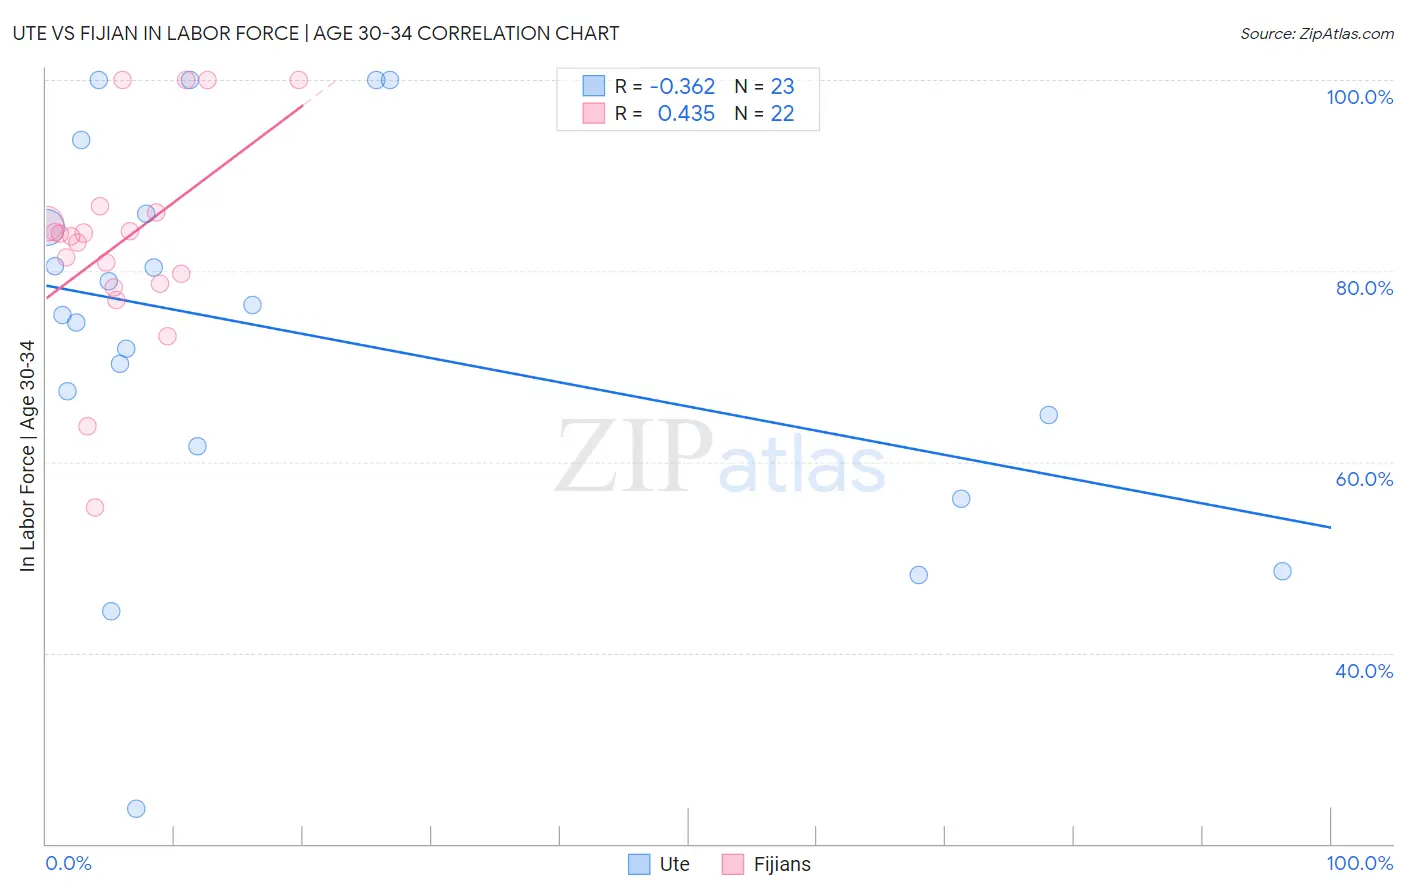
Ute vs Fijian In Labor Force | Age 30-34 Correlation Chart
The statistical analysis conducted on geographies consisting of 55,664,473 people shows a mild negative correlation between the proportion of Ute and labor force participation rate among population between the ages 30 and 34 in the United States with a correlation coefficient (R) of -0.362 and weighted average of 78.9%. Similarly, the statistical analysis conducted on geographies consisting of 55,946,113 people shows a moderate positive correlation between the proportion of Fijians and labor force participation rate among population between the ages 30 and 34 in the United States with a correlation coefficient (R) of 0.435 and weighted average of 83.4%, a difference of 5.7%.
In Labor Force | Age 30-34 Correlation Summary
| Measurement | Ute | Fijian |
| Minimum | 23.7% | 55.2% |
| Maximum | 100.0% | 100.0% |
| Range | 76.3% | 44.8% |
| Mean | 73.4% | 83.1% |
| Median | 75.4% | 83.8% |
| Interquartile 25% (IQ1) | 61.7% | 78.7% |
| Interquartile 75% (IQ3) | 86.0% | 86.1% |
| Interquartile Range (IQR) | 24.3% | 7.4% |
| Standard Deviation (Sample) | 20.0% | 11.0% |
| Standard Deviation (Population) | 19.6% | 10.7% |
Similar Demographics by In Labor Force | Age 30-34
Demographics Similar to Ute by In Labor Force | Age 30-34
In terms of in labor force | age 30-34, the demographic groups most similar to Ute are Apache (79.0%, a difference of 0.10%), Pima (79.0%, a difference of 0.13%), Yakama (79.1%, a difference of 0.25%), Native/Alaskan (79.2%, a difference of 0.29%), and Marshallese (79.2%, a difference of 0.37%).
| Demographics | Rating | Rank | In Labor Force | Age 30-34 |
| Inupiat | 0.0 /100 | #333 | Tragic 79.7% |
| Hopi | 0.0 /100 | #334 | Tragic 79.3% |
| Marshallese | 0.0 /100 | #335 | Tragic 79.2% |
| Natives/Alaskans | 0.0 /100 | #336 | Tragic 79.2% |
| Yakama | 0.0 /100 | #337 | Tragic 79.1% |
| Pima | 0.0 /100 | #338 | Tragic 79.0% |
| Apache | 0.0 /100 | #339 | Tragic 79.0% |
| Ute | 0.0 /100 | #340 | Tragic 78.9% |
| Immigrants | Yemen | 0.0 /100 | #341 | Tragic 78.2% |
| Tohono O'odham | 0.0 /100 | #342 | Tragic 77.7% |
| Lumbee | 0.0 /100 | #343 | Tragic 77.3% |
| Yuman | 0.0 /100 | #344 | Tragic 77.1% |
| Yup'ik | 0.0 /100 | #345 | Tragic 76.4% |
| Crow | 0.0 /100 | #346 | Tragic 75.9% |
| Navajo | 0.0 /100 | #347 | Tragic 73.8% |
Demographics Similar to Fijians by In Labor Force | Age 30-34
In terms of in labor force | age 30-34, the demographic groups most similar to Fijians are Immigrants from Fiji (83.4%, a difference of 0.010%), African (83.4%, a difference of 0.040%), Delaware (83.5%, a difference of 0.050%), Tongan (83.5%, a difference of 0.070%), and Immigrants from Grenada (83.5%, a difference of 0.080%).
| Demographics | Rating | Rank | In Labor Force | Age 30-34 |
| Spanish | 0.0 /100 | #271 | Tragic 83.5% |
| Immigrants | Nonimmigrants | 0.0 /100 | #272 | Tragic 83.5% |
| Guamanians/Chamorros | 0.0 /100 | #273 | Tragic 83.5% |
| Belizeans | 0.0 /100 | #274 | Tragic 83.5% |
| Immigrants | Grenada | 0.0 /100 | #275 | Tragic 83.5% |
| Tongans | 0.0 /100 | #276 | Tragic 83.5% |
| Delaware | 0.0 /100 | #277 | Tragic 83.5% |
| Fijians | 0.0 /100 | #278 | Tragic 83.4% |
| Immigrants | Fiji | 0.0 /100 | #279 | Tragic 83.4% |
| Africans | 0.0 /100 | #280 | Tragic 83.4% |
| Samoans | 0.0 /100 | #281 | Tragic 83.3% |
| Mexican American Indians | 0.0 /100 | #282 | Tragic 83.2% |
| Assyrians/Chaldeans/Syriacs | 0.0 /100 | #283 | Tragic 83.2% |
| Immigrants | Belize | 0.0 /100 | #284 | Tragic 83.2% |
| Cree | 0.0 /100 | #285 | Tragic 83.2% |