Immigrants from Albania vs Fijian Disability Age 18 to 34
COMPARE
Immigrants from Albania
Fijian
Disability Age 18 to 34
Disability Age 18 to 34 Comparison
Immigrants from Albania
Fijians
6.2%
DISABILITY AGE 18 TO 34
96.7/ 100
METRIC RATING
100th/ 347
METRIC RANK
7.2%
DISABILITY AGE 18 TO 34
0.6/ 100
METRIC RATING
250th/ 347
METRIC RANK
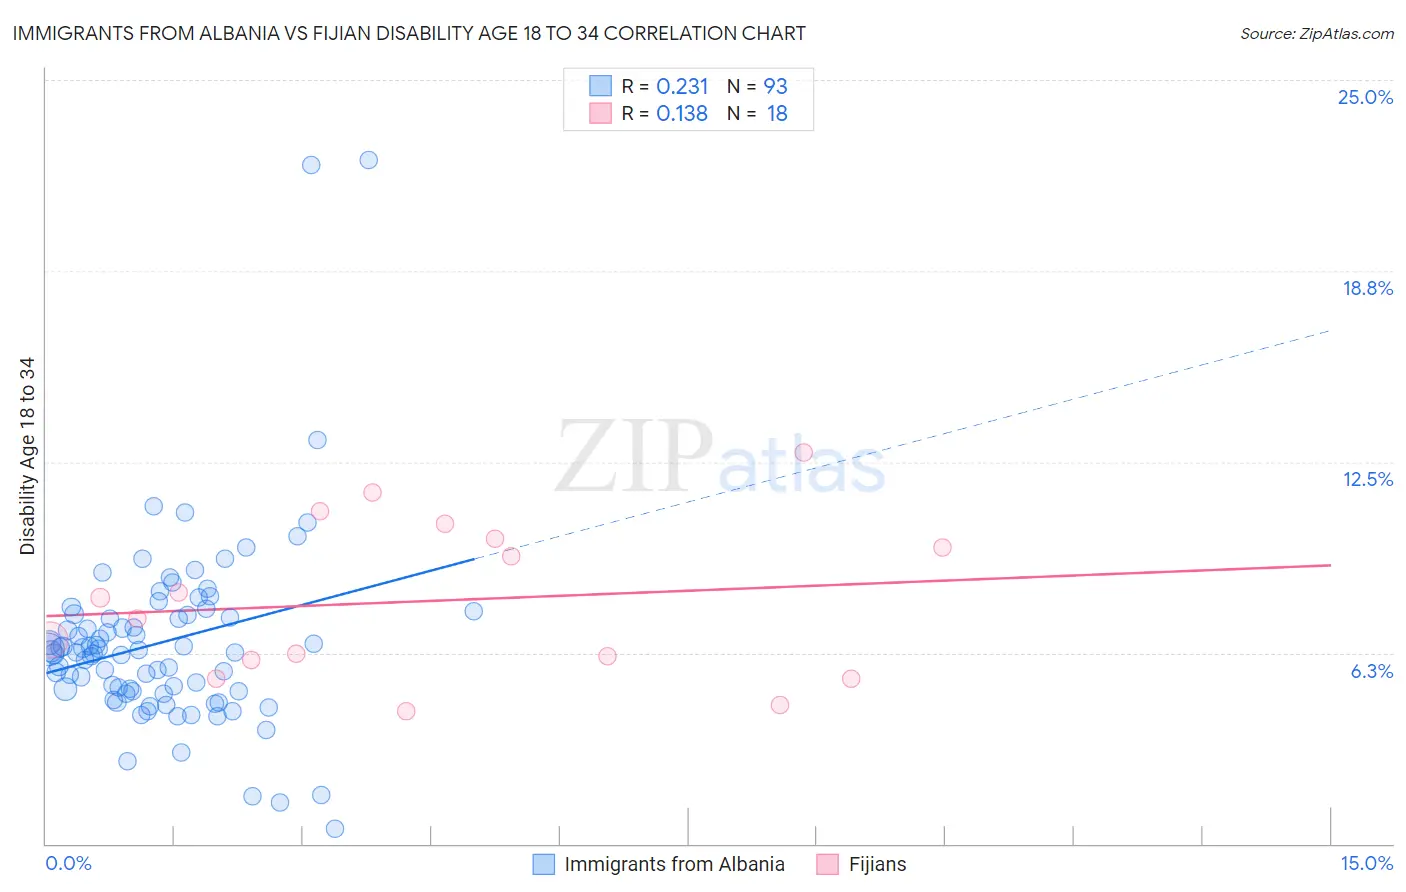
Immigrants from Albania vs Fijian Disability Age 18 to 34 Correlation Chart
The statistical analysis conducted on geographies consisting of 119,289,969 people shows a weak positive correlation between the proportion of Immigrants from Albania and percentage of population with a disability between the ages 18 and 35 in the United States with a correlation coefficient (R) of 0.231 and weighted average of 6.2%. Similarly, the statistical analysis conducted on geographies consisting of 55,913,538 people shows a poor positive correlation between the proportion of Fijians and percentage of population with a disability between the ages 18 and 35 in the United States with a correlation coefficient (R) of 0.138 and weighted average of 7.2%, a difference of 15.7%.
Disability Age 18 to 34 Correlation Summary
| Measurement | Immigrants from Albania | Fijian |
| Minimum | 0.51% | 4.3% |
| Maximum | 22.4% | 12.8% |
| Range | 21.9% | 8.5% |
| Mean | 6.6% | 7.9% |
| Median | 6.3% | 7.7% |
| Interquartile 25% (IQ1) | 5.0% | 6.0% |
| Interquartile 75% (IQ3) | 7.5% | 10.0% |
| Interquartile Range (IQR) | 2.5% | 4.0% |
| Standard Deviation (Sample) | 3.2% | 2.5% |
| Standard Deviation (Population) | 3.1% | 2.5% |
Similar Demographics by Disability Age 18 to 34
Demographics Similar to Immigrants from Albania by Disability Age 18 to 34
In terms of disability age 18 to 34, the demographic groups most similar to Immigrants from Albania are Immigrants from Ethiopia (6.2%, a difference of 0.12%), Immigrants from Jamaica (6.2%, a difference of 0.16%), Laotian (6.2%, a difference of 0.18%), Immigrants from Bulgaria (6.2%, a difference of 0.19%), and Mongolian (6.2%, a difference of 0.28%).
| Demographics | Rating | Rank | Disability Age 18 to 34 |
| Immigrants | Immigrants | 97.6 /100 | #93 | Exceptional 6.2% |
| Immigrants | Kazakhstan | 97.5 /100 | #94 | Exceptional 6.2% |
| Central Americans | 97.5 /100 | #95 | Exceptional 6.2% |
| Immigrants | Uruguay | 97.4 /100 | #96 | Exceptional 6.2% |
| Uruguayans | 97.3 /100 | #97 | Exceptional 6.2% |
| Immigrants | Syria | 97.2 /100 | #98 | Exceptional 6.2% |
| Immigrants | Ethiopia | 96.9 /100 | #99 | Exceptional 6.2% |
| Immigrants | Albania | 96.7 /100 | #100 | Exceptional 6.2% |
| Immigrants | Jamaica | 96.4 /100 | #101 | Exceptional 6.2% |
| Laotians | 96.4 /100 | #102 | Exceptional 6.2% |
| Immigrants | Bulgaria | 96.3 /100 | #103 | Exceptional 6.2% |
| Mongolians | 96.2 /100 | #104 | Exceptional 6.2% |
| Bhutanese | 96.2 /100 | #105 | Exceptional 6.2% |
| Immigrants | Afghanistan | 95.9 /100 | #106 | Exceptional 6.2% |
| Ethiopians | 95.8 /100 | #107 | Exceptional 6.2% |
Demographics Similar to Fijians by Disability Age 18 to 34
In terms of disability age 18 to 34, the demographic groups most similar to Fijians are Spaniard (7.2%, a difference of 0.010%), Polish (7.2%, a difference of 0.030%), Malaysian (7.2%, a difference of 0.29%), Croatian (7.2%, a difference of 0.30%), and Guamanian/Chamorro (7.2%, a difference of 0.39%).
| Demographics | Rating | Rank | Disability Age 18 to 34 |
| Icelanders | 1.0 /100 | #243 | Tragic 7.1% |
| Immigrants | Zaire | 0.9 /100 | #244 | Tragic 7.1% |
| Hungarians | 0.9 /100 | #245 | Tragic 7.1% |
| Immigrants | Liberia | 0.8 /100 | #246 | Tragic 7.1% |
| Yugoslavians | 0.8 /100 | #247 | Tragic 7.2% |
| Guamanians/Chamorros | 0.8 /100 | #248 | Tragic 7.2% |
| Malaysians | 0.7 /100 | #249 | Tragic 7.2% |
| Fijians | 0.6 /100 | #250 | Tragic 7.2% |
| Spaniards | 0.6 /100 | #251 | Tragic 7.2% |
| Poles | 0.6 /100 | #252 | Tragic 7.2% |
| Croatians | 0.5 /100 | #253 | Tragic 7.2% |
| Indonesians | 0.4 /100 | #254 | Tragic 7.2% |
| Immigrants | Germany | 0.4 /100 | #255 | Tragic 7.2% |
| Immigrants | Laos | 0.4 /100 | #256 | Tragic 7.2% |
| Czechs | 0.3 /100 | #257 | Tragic 7.2% |