Immigrants from Lithuania vs Fijian Disability Age 18 to 34
COMPARE
Immigrants from Lithuania
Fijian
Disability Age 18 to 34
Disability Age 18 to 34 Comparison
Immigrants from Lithuania
Fijians
5.8%
DISABILITY AGE 18 TO 34
99.9/ 100
METRIC RATING
35th/ 347
METRIC RANK
7.2%
DISABILITY AGE 18 TO 34
0.6/ 100
METRIC RATING
250th/ 347
METRIC RANK
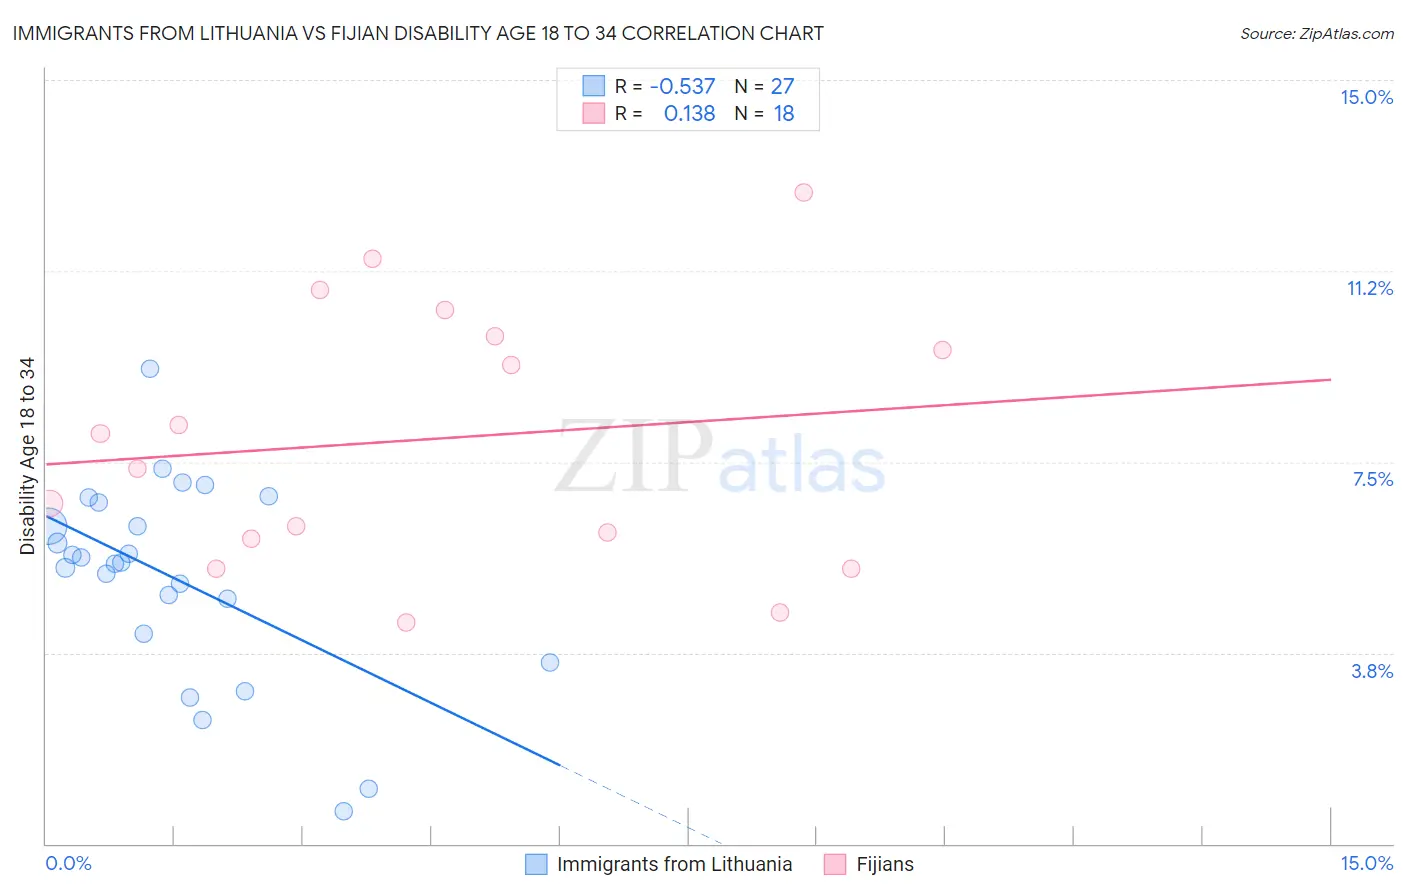
Immigrants from Lithuania vs Fijian Disability Age 18 to 34 Correlation Chart
The statistical analysis conducted on geographies consisting of 117,646,211 people shows a substantial negative correlation between the proportion of Immigrants from Lithuania and percentage of population with a disability between the ages 18 and 35 in the United States with a correlation coefficient (R) of -0.537 and weighted average of 5.8%. Similarly, the statistical analysis conducted on geographies consisting of 55,913,538 people shows a poor positive correlation between the proportion of Fijians and percentage of population with a disability between the ages 18 and 35 in the United States with a correlation coefficient (R) of 0.138 and weighted average of 7.2%, a difference of 24.0%.
Disability Age 18 to 34 Correlation Summary
| Measurement | Immigrants from Lithuania | Fijian |
| Minimum | 0.65% | 4.3% |
| Maximum | 9.3% | 12.8% |
| Range | 8.7% | 8.5% |
| Mean | 5.2% | 7.9% |
| Median | 5.5% | 7.7% |
| Interquartile 25% (IQ1) | 4.1% | 6.0% |
| Interquartile 75% (IQ3) | 6.7% | 10.0% |
| Interquartile Range (IQR) | 2.6% | 4.0% |
| Standard Deviation (Sample) | 2.0% | 2.5% |
| Standard Deviation (Population) | 1.9% | 2.5% |
Similar Demographics by Disability Age 18 to 34
Demographics Similar to Immigrants from Lithuania by Disability Age 18 to 34
In terms of disability age 18 to 34, the demographic groups most similar to Immigrants from Lithuania are Ecuadorian (5.8%, a difference of 0.15%), Venezuelan (5.8%, a difference of 0.22%), Armenian (5.8%, a difference of 0.24%), Immigrants from South America (5.8%, a difference of 0.27%), and Argentinean (5.8%, a difference of 0.41%).
| Demographics | Rating | Rank | Disability Age 18 to 34 |
| Soviet Union | 99.9 /100 | #28 | Exceptional 5.7% |
| Immigrants | Ecuador | 99.9 /100 | #29 | Exceptional 5.7% |
| Immigrants | Pakistan | 99.9 /100 | #30 | Exceptional 5.8% |
| Iranians | 99.9 /100 | #31 | Exceptional 5.8% |
| Immigrants | Barbados | 99.9 /100 | #32 | Exceptional 5.8% |
| Argentineans | 99.9 /100 | #33 | Exceptional 5.8% |
| Venezuelans | 99.9 /100 | #34 | Exceptional 5.8% |
| Immigrants | Lithuania | 99.9 /100 | #35 | Exceptional 5.8% |
| Ecuadorians | 99.9 /100 | #36 | Exceptional 5.8% |
| Armenians | 99.9 /100 | #37 | Exceptional 5.8% |
| Immigrants | South America | 99.9 /100 | #38 | Exceptional 5.8% |
| Asians | 99.9 /100 | #39 | Exceptional 5.8% |
| Bolivians | 99.9 /100 | #40 | Exceptional 5.8% |
| Nicaraguans | 99.9 /100 | #41 | Exceptional 5.8% |
| Colombians | 99.8 /100 | #42 | Exceptional 5.9% |
Demographics Similar to Fijians by Disability Age 18 to 34
In terms of disability age 18 to 34, the demographic groups most similar to Fijians are Spaniard (7.2%, a difference of 0.010%), Polish (7.2%, a difference of 0.030%), Malaysian (7.2%, a difference of 0.29%), Croatian (7.2%, a difference of 0.30%), and Guamanian/Chamorro (7.2%, a difference of 0.39%).
| Demographics | Rating | Rank | Disability Age 18 to 34 |
| Icelanders | 1.0 /100 | #243 | Tragic 7.1% |
| Immigrants | Zaire | 0.9 /100 | #244 | Tragic 7.1% |
| Hungarians | 0.9 /100 | #245 | Tragic 7.1% |
| Immigrants | Liberia | 0.8 /100 | #246 | Tragic 7.1% |
| Yugoslavians | 0.8 /100 | #247 | Tragic 7.2% |
| Guamanians/Chamorros | 0.8 /100 | #248 | Tragic 7.2% |
| Malaysians | 0.7 /100 | #249 | Tragic 7.2% |
| Fijians | 0.6 /100 | #250 | Tragic 7.2% |
| Spaniards | 0.6 /100 | #251 | Tragic 7.2% |
| Poles | 0.6 /100 | #252 | Tragic 7.2% |
| Croatians | 0.5 /100 | #253 | Tragic 7.2% |
| Indonesians | 0.4 /100 | #254 | Tragic 7.2% |
| Immigrants | Germany | 0.4 /100 | #255 | Tragic 7.2% |
| Immigrants | Laos | 0.4 /100 | #256 | Tragic 7.2% |
| Czechs | 0.3 /100 | #257 | Tragic 7.2% |