U.S. Virgin Islander vs Immigrants from Dominican Republic Disability
COMPARE
U.S. Virgin Islander
Immigrants from Dominican Republic
Disability
Disability Comparison
U.S. Virgin Islanders
Immigrants from Dominican Republic
12.5%
DISABILITY
0.2/ 100
METRIC RATING
265th/ 347
METRIC RANK
12.6%
DISABILITY
0.1/ 100
METRIC RATING
269th/ 347
METRIC RANK
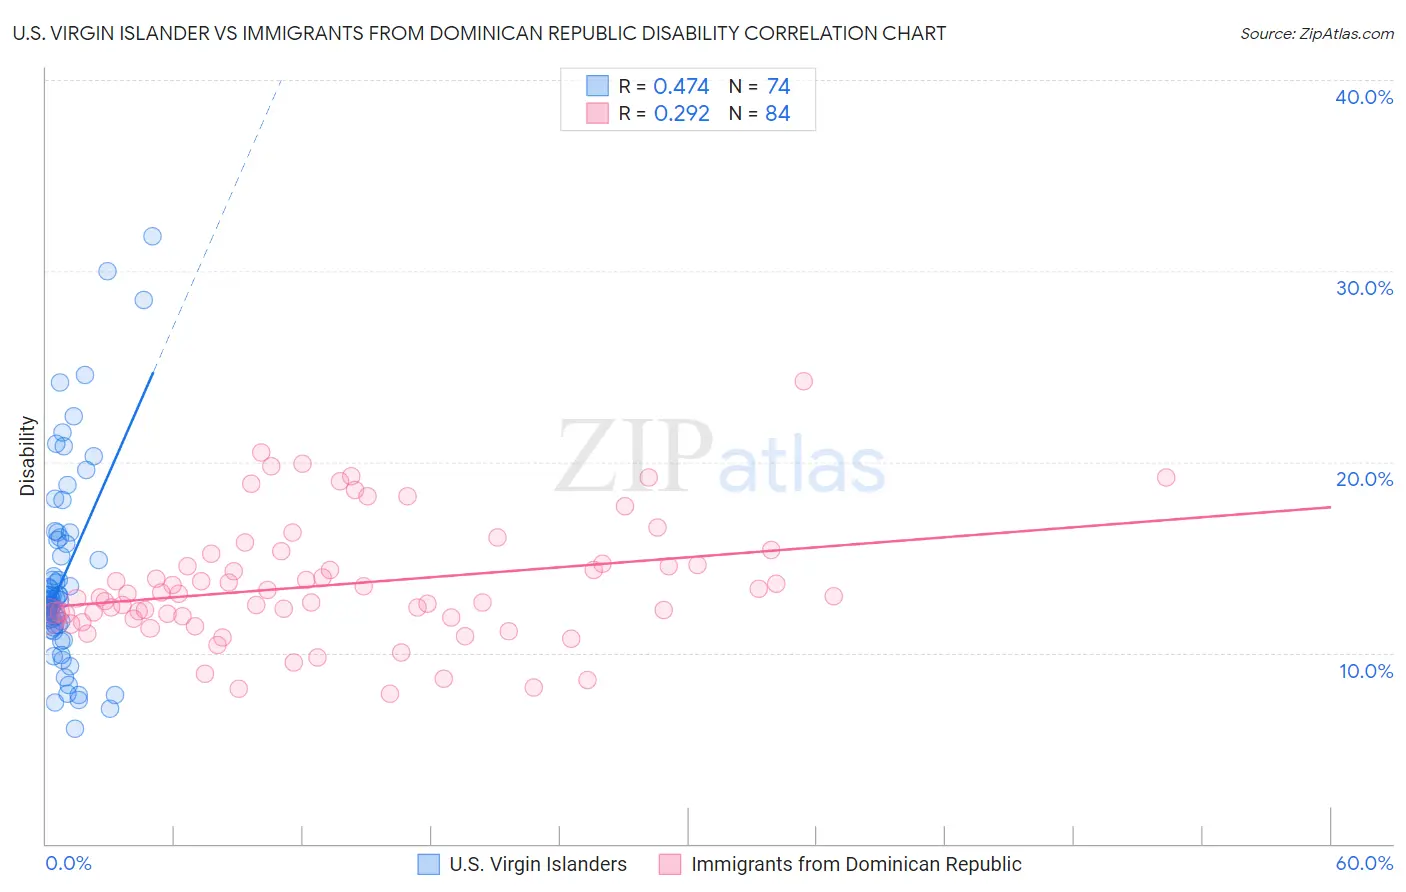
U.S. Virgin Islander vs Immigrants from Dominican Republic Disability Correlation Chart
The statistical analysis conducted on geographies consisting of 87,526,071 people shows a moderate positive correlation between the proportion of U.S. Virgin Islanders and percentage of population with a disability in the United States with a correlation coefficient (R) of 0.474 and weighted average of 12.5%. Similarly, the statistical analysis conducted on geographies consisting of 275,091,051 people shows a weak positive correlation between the proportion of Immigrants from Dominican Republic and percentage of population with a disability in the United States with a correlation coefficient (R) of 0.292 and weighted average of 12.6%, a difference of 0.66%.
Disability Correlation Summary
| Measurement | U.S. Virgin Islander | Immigrants from Dominican Republic |
| Minimum | 6.0% | 7.9% |
| Maximum | 31.8% | 24.2% |
| Range | 25.8% | 16.4% |
| Mean | 14.0% | 13.6% |
| Median | 12.8% | 12.9% |
| Interquartile 25% (IQ1) | 11.5% | 11.9% |
| Interquartile 75% (IQ3) | 15.9% | 14.6% |
| Interquartile Range (IQR) | 4.5% | 2.7% |
| Standard Deviation (Sample) | 5.2% | 3.2% |
| Standard Deviation (Population) | 5.1% | 3.1% |
Demographics Similar to U.S. Virgin Islanders and Immigrants from Dominican Republic by Disability
In terms of disability, the demographic groups most similar to U.S. Virgin Islanders are Immigrants from Germany (12.5%, a difference of 0.020%), Hawaiian (12.5%, a difference of 0.13%), Czechoslovakian (12.5%, a difference of 0.16%), Spaniard (12.5%, a difference of 0.24%), and Native Hawaiian (12.5%, a difference of 0.33%). Similarly, the demographic groups most similar to Immigrants from Dominican Republic are Bangladeshi (12.6%, a difference of 0.090%), Portuguese (12.6%, a difference of 0.39%), Spaniard (12.5%, a difference of 0.42%), Immigrants from Yemen (12.6%, a difference of 0.44%), and Czechoslovakian (12.5%, a difference of 0.49%).
| Demographics | Rating | Rank | Disability |
| Immigrants | Laos | 0.5 /100 | #257 | Tragic 12.4% |
| Slavs | 0.5 /100 | #258 | Tragic 12.4% |
| Canadians | 0.4 /100 | #259 | Tragic 12.4% |
| Immigrants | Liberia | 0.4 /100 | #260 | Tragic 12.4% |
| Scandinavians | 0.4 /100 | #261 | Tragic 12.4% |
| Native Hawaiians | 0.3 /100 | #262 | Tragic 12.5% |
| Hawaiians | 0.2 /100 | #263 | Tragic 12.5% |
| Immigrants | Germany | 0.2 /100 | #264 | Tragic 12.5% |
| U.S. Virgin Islanders | 0.2 /100 | #265 | Tragic 12.5% |
| Czechoslovakians | 0.2 /100 | #266 | Tragic 12.5% |
| Spaniards | 0.2 /100 | #267 | Tragic 12.5% |
| Bangladeshis | 0.1 /100 | #268 | Tragic 12.6% |
| Immigrants | Dominican Republic | 0.1 /100 | #269 | Tragic 12.6% |
| Portuguese | 0.1 /100 | #270 | Tragic 12.6% |
| Immigrants | Yemen | 0.1 /100 | #271 | Tragic 12.6% |
| Dominicans | 0.0 /100 | #272 | Tragic 12.7% |
| Finns | 0.0 /100 | #273 | Tragic 12.7% |
| Nepalese | 0.0 /100 | #274 | Tragic 12.8% |
| Sioux | 0.0 /100 | #275 | Tragic 12.8% |
| Hmong | 0.0 /100 | #276 | Tragic 12.8% |
| Dutch | 0.0 /100 | #277 | Tragic 12.8% |