U.S. Virgin Islander vs Sri Lankan In Labor Force | Age 30-34
COMPARE
U.S. Virgin Islander
Sri Lankan
In Labor Force | Age 30-34
In Labor Force | Age 30-34 Comparison
U.S. Virgin Islanders
Sri Lankans
84.1%
IN LABOR FORCE | AGE 30-34
1.5/ 100
METRIC RATING
236th/ 347
METRIC RANK
85.0%
IN LABOR FORCE | AGE 30-34
87.8/ 100
METRIC RATING
138th/ 347
METRIC RANK
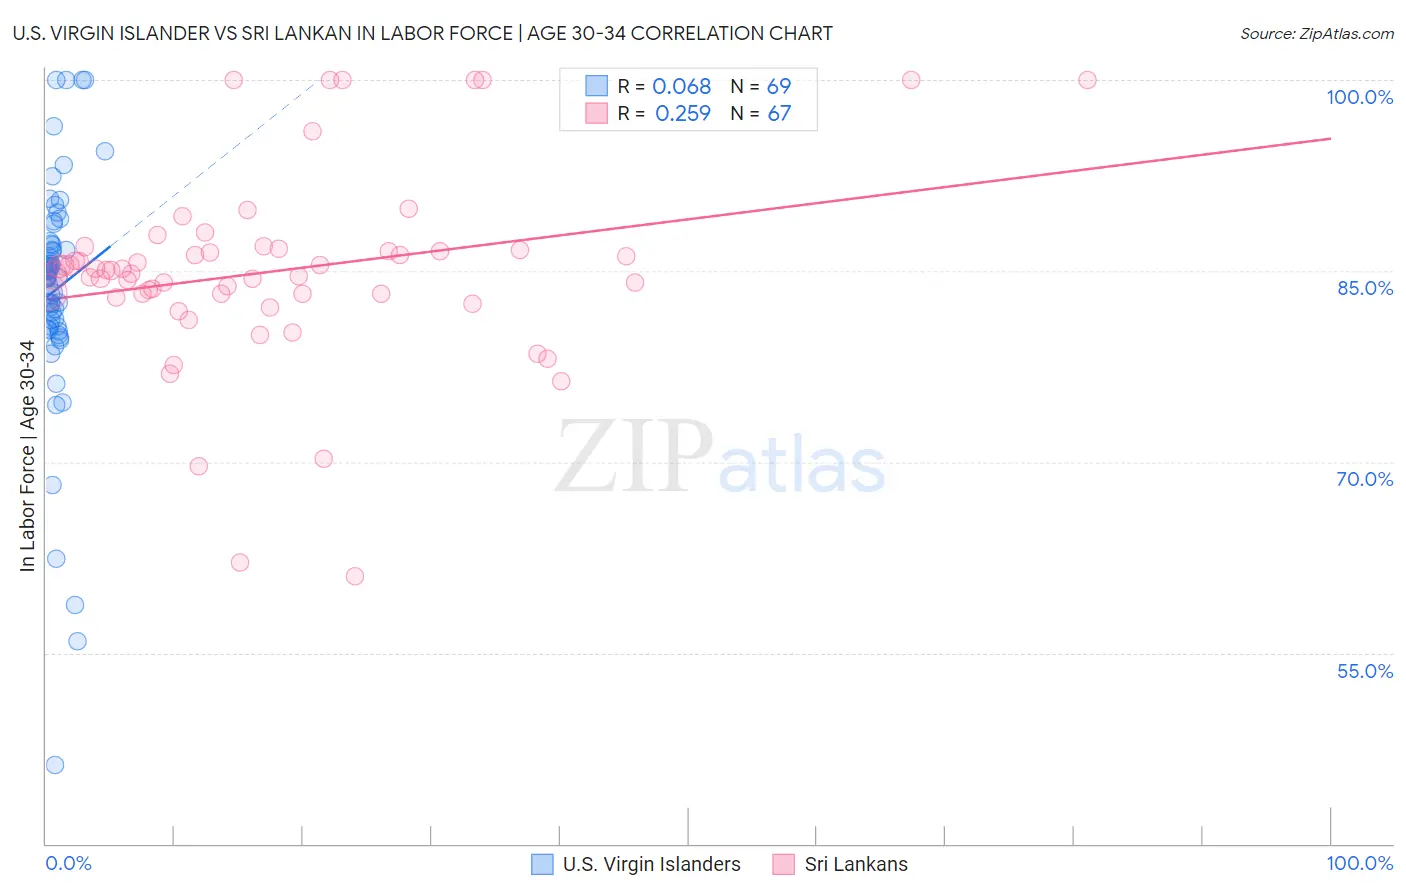
U.S. Virgin Islander vs Sri Lankan In Labor Force | Age 30-34 Correlation Chart
The statistical analysis conducted on geographies consisting of 87,504,880 people shows a slight positive correlation between the proportion of U.S. Virgin Islanders and labor force participation rate among population between the ages 30 and 34 in the United States with a correlation coefficient (R) of 0.068 and weighted average of 84.1%. Similarly, the statistical analysis conducted on geographies consisting of 440,177,214 people shows a weak positive correlation between the proportion of Sri Lankans and labor force participation rate among population between the ages 30 and 34 in the United States with a correlation coefficient (R) of 0.259 and weighted average of 85.0%, a difference of 1.1%.
In Labor Force | Age 30-34 Correlation Summary
| Measurement | U.S. Virgin Islander | Sri Lankan |
| Minimum | 46.2% | 61.0% |
| Maximum | 100.0% | 100.0% |
| Range | 53.8% | 39.0% |
| Mean | 83.5% | 85.0% |
| Median | 84.6% | 85.0% |
| Interquartile 25% (IQ1) | 80.6% | 83.2% |
| Interquartile 75% (IQ3) | 87.1% | 86.6% |
| Interquartile Range (IQR) | 6.5% | 3.4% |
| Standard Deviation (Sample) | 9.2% | 7.6% |
| Standard Deviation (Population) | 9.1% | 7.5% |
Similar Demographics by In Labor Force | Age 30-34
Demographics Similar to U.S. Virgin Islanders by In Labor Force | Age 30-34
In terms of in labor force | age 30-34, the demographic groups most similar to U.S. Virgin Islanders are Celtic (84.1%, a difference of 0.010%), French American Indian (84.1%, a difference of 0.020%), Immigrants from Barbados (84.0%, a difference of 0.020%), English (84.0%, a difference of 0.020%), and Venezuelan (84.0%, a difference of 0.020%).
| Demographics | Rating | Rank | In Labor Force | Age 30-34 |
| Welsh | 2.7 /100 | #229 | Tragic 84.2% |
| Immigrants | Bahamas | 2.6 /100 | #230 | Tragic 84.1% |
| Malaysians | 2.2 /100 | #231 | Tragic 84.1% |
| Immigrants | Immigrants | 2.0 /100 | #232 | Tragic 84.1% |
| West Indians | 1.9 /100 | #233 | Tragic 84.1% |
| Haitians | 1.8 /100 | #234 | Tragic 84.1% |
| French American Indians | 1.7 /100 | #235 | Tragic 84.1% |
| U.S. Virgin Islanders | 1.5 /100 | #236 | Tragic 84.1% |
| Celtics | 1.4 /100 | #237 | Tragic 84.1% |
| Immigrants | Barbados | 1.4 /100 | #238 | Tragic 84.0% |
| English | 1.4 /100 | #239 | Tragic 84.0% |
| Venezuelans | 1.3 /100 | #240 | Tragic 84.0% |
| Immigrants | Portugal | 1.2 /100 | #241 | Tragic 84.0% |
| Immigrants | Oceania | 1.1 /100 | #242 | Tragic 84.0% |
| Immigrants | Caribbean | 1.1 /100 | #243 | Tragic 84.0% |
Demographics Similar to Sri Lankans by In Labor Force | Age 30-34
In terms of in labor force | age 30-34, the demographic groups most similar to Sri Lankans are South African (85.0%, a difference of 0.0%), Jordanian (85.0%, a difference of 0.010%), Bhutanese (85.0%, a difference of 0.010%), Immigrants from Chile (85.0%, a difference of 0.020%), and Immigrants from Asia (85.0%, a difference of 0.020%).
| Demographics | Rating | Rank | In Labor Force | Age 30-34 |
| Chinese | 89.6 /100 | #131 | Excellent 85.0% |
| Immigrants | Israel | 89.5 /100 | #132 | Excellent 85.0% |
| New Zealanders | 89.5 /100 | #133 | Excellent 85.0% |
| Immigrants | Chile | 89.2 /100 | #134 | Excellent 85.0% |
| Immigrants | Asia | 88.9 /100 | #135 | Excellent 85.0% |
| Jordanians | 88.6 /100 | #136 | Excellent 85.0% |
| South Africans | 88.0 /100 | #137 | Excellent 85.0% |
| Sri Lankans | 87.8 /100 | #138 | Excellent 85.0% |
| Bhutanese | 87.5 /100 | #139 | Excellent 85.0% |
| Immigrants | Vietnam | 86.5 /100 | #140 | Excellent 85.0% |
| Chileans | 85.3 /100 | #141 | Excellent 84.9% |
| Immigrants | Indonesia | 84.3 /100 | #142 | Excellent 84.9% |
| Colombians | 82.2 /100 | #143 | Excellent 84.9% |
| Uruguayans | 78.5 /100 | #144 | Good 84.9% |
| Palestinians | 77.7 /100 | #145 | Good 84.9% |