U.S. Virgin Islander vs Celtic Disability
COMPARE
U.S. Virgin Islander
Celtic
Disability
Disability Comparison
U.S. Virgin Islanders
Celtics
12.5%
DISABILITY
0.2/ 100
METRIC RATING
265th/ 347
METRIC RANK
13.1%
DISABILITY
0.0/ 100
METRIC RATING
294th/ 347
METRIC RANK
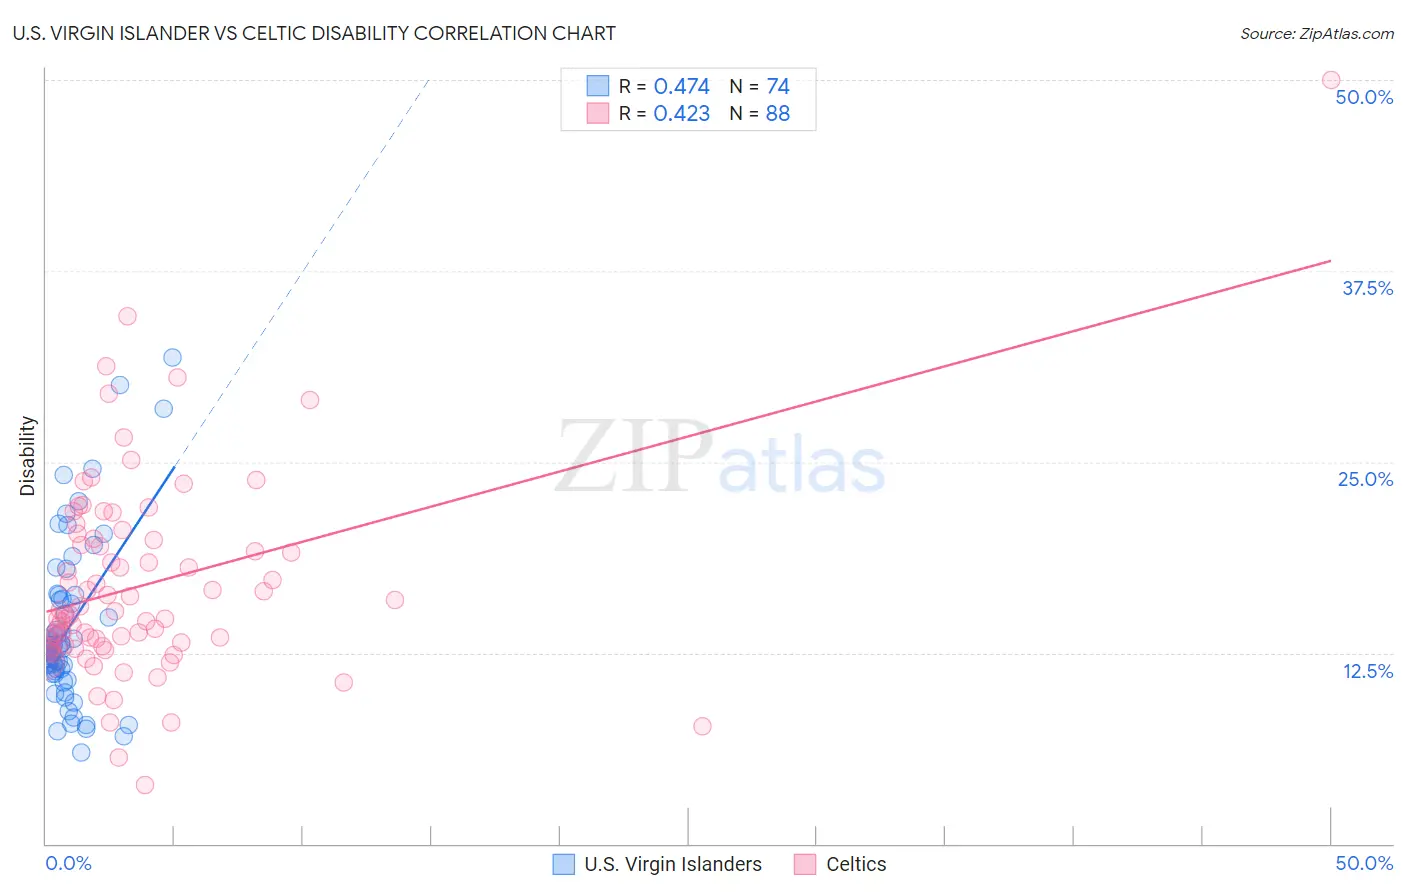
U.S. Virgin Islander vs Celtic Disability Correlation Chart
The statistical analysis conducted on geographies consisting of 87,526,071 people shows a moderate positive correlation between the proportion of U.S. Virgin Islanders and percentage of population with a disability in the United States with a correlation coefficient (R) of 0.474 and weighted average of 12.5%. Similarly, the statistical analysis conducted on geographies consisting of 168,868,984 people shows a moderate positive correlation between the proportion of Celtics and percentage of population with a disability in the United States with a correlation coefficient (R) of 0.423 and weighted average of 13.1%, a difference of 5.2%.
Disability Correlation Summary
| Measurement | U.S. Virgin Islander | Celtic |
| Minimum | 6.0% | 3.8% |
| Maximum | 31.8% | 50.0% |
| Range | 25.8% | 46.2% |
| Mean | 14.0% | 16.9% |
| Median | 12.8% | 15.1% |
| Interquartile 25% (IQ1) | 11.5% | 13.0% |
| Interquartile 75% (IQ3) | 15.9% | 19.9% |
| Interquartile Range (IQR) | 4.5% | 6.9% |
| Standard Deviation (Sample) | 5.2% | 6.7% |
| Standard Deviation (Population) | 5.1% | 6.7% |
Similar Demographics by Disability
Demographics Similar to U.S. Virgin Islanders by Disability
In terms of disability, the demographic groups most similar to U.S. Virgin Islanders are Immigrants from Germany (12.5%, a difference of 0.020%), Hawaiian (12.5%, a difference of 0.13%), Czechoslovakian (12.5%, a difference of 0.16%), Spaniard (12.5%, a difference of 0.24%), and Native Hawaiian (12.5%, a difference of 0.33%).
| Demographics | Rating | Rank | Disability |
| Slavs | 0.5 /100 | #258 | Tragic 12.4% |
| Canadians | 0.4 /100 | #259 | Tragic 12.4% |
| Immigrants | Liberia | 0.4 /100 | #260 | Tragic 12.4% |
| Scandinavians | 0.4 /100 | #261 | Tragic 12.4% |
| Native Hawaiians | 0.3 /100 | #262 | Tragic 12.5% |
| Hawaiians | 0.2 /100 | #263 | Tragic 12.5% |
| Immigrants | Germany | 0.2 /100 | #264 | Tragic 12.5% |
| U.S. Virgin Islanders | 0.2 /100 | #265 | Tragic 12.5% |
| Czechoslovakians | 0.2 /100 | #266 | Tragic 12.5% |
| Spaniards | 0.2 /100 | #267 | Tragic 12.5% |
| Bangladeshis | 0.1 /100 | #268 | Tragic 12.6% |
| Immigrants | Dominican Republic | 0.1 /100 | #269 | Tragic 12.6% |
| Portuguese | 0.1 /100 | #270 | Tragic 12.6% |
| Immigrants | Yemen | 0.1 /100 | #271 | Tragic 12.6% |
| Dominicans | 0.0 /100 | #272 | Tragic 12.7% |
Demographics Similar to Celtics by Disability
In terms of disability, the demographic groups most similar to Celtics are Nonimmigrants (13.2%, a difference of 0.12%), Central American Indian (13.2%, a difference of 0.16%), Hopi (13.2%, a difference of 0.22%), Alaska Native (13.2%, a difference of 0.23%), and French (13.2%, a difference of 0.25%).
| Demographics | Rating | Rank | Disability |
| Africans | 0.0 /100 | #287 | Tragic 13.0% |
| Whites/Caucasians | 0.0 /100 | #288 | Tragic 13.0% |
| Slovaks | 0.0 /100 | #289 | Tragic 13.0% |
| Cheyenne | 0.0 /100 | #290 | Tragic 13.0% |
| Yaqui | 0.0 /100 | #291 | Tragic 13.1% |
| Aleuts | 0.0 /100 | #292 | Tragic 13.1% |
| Marshallese | 0.0 /100 | #293 | Tragic 13.1% |
| Celtics | 0.0 /100 | #294 | Tragic 13.1% |
| Immigrants | Nonimmigrants | 0.0 /100 | #295 | Tragic 13.2% |
| Central American Indians | 0.0 /100 | #296 | Tragic 13.2% |
| Hopi | 0.0 /100 | #297 | Tragic 13.2% |
| Alaska Natives | 0.0 /100 | #298 | Tragic 13.2% |
| French | 0.0 /100 | #299 | Tragic 13.2% |
| Pennsylvania Germans | 0.0 /100 | #300 | Tragic 13.2% |
| Immigrants | Micronesia | 0.0 /100 | #301 | Tragic 13.2% |