U.S. Virgin Islander vs Mexican Disability
COMPARE
U.S. Virgin Islander
Mexican
Disability
Disability Comparison
U.S. Virgin Islanders
Mexicans
12.5%
DISABILITY
0.2/ 100
METRIC RATING
265th/ 347
METRIC RANK
12.1%
DISABILITY
3.7/ 100
METRIC RATING
224th/ 347
METRIC RANK
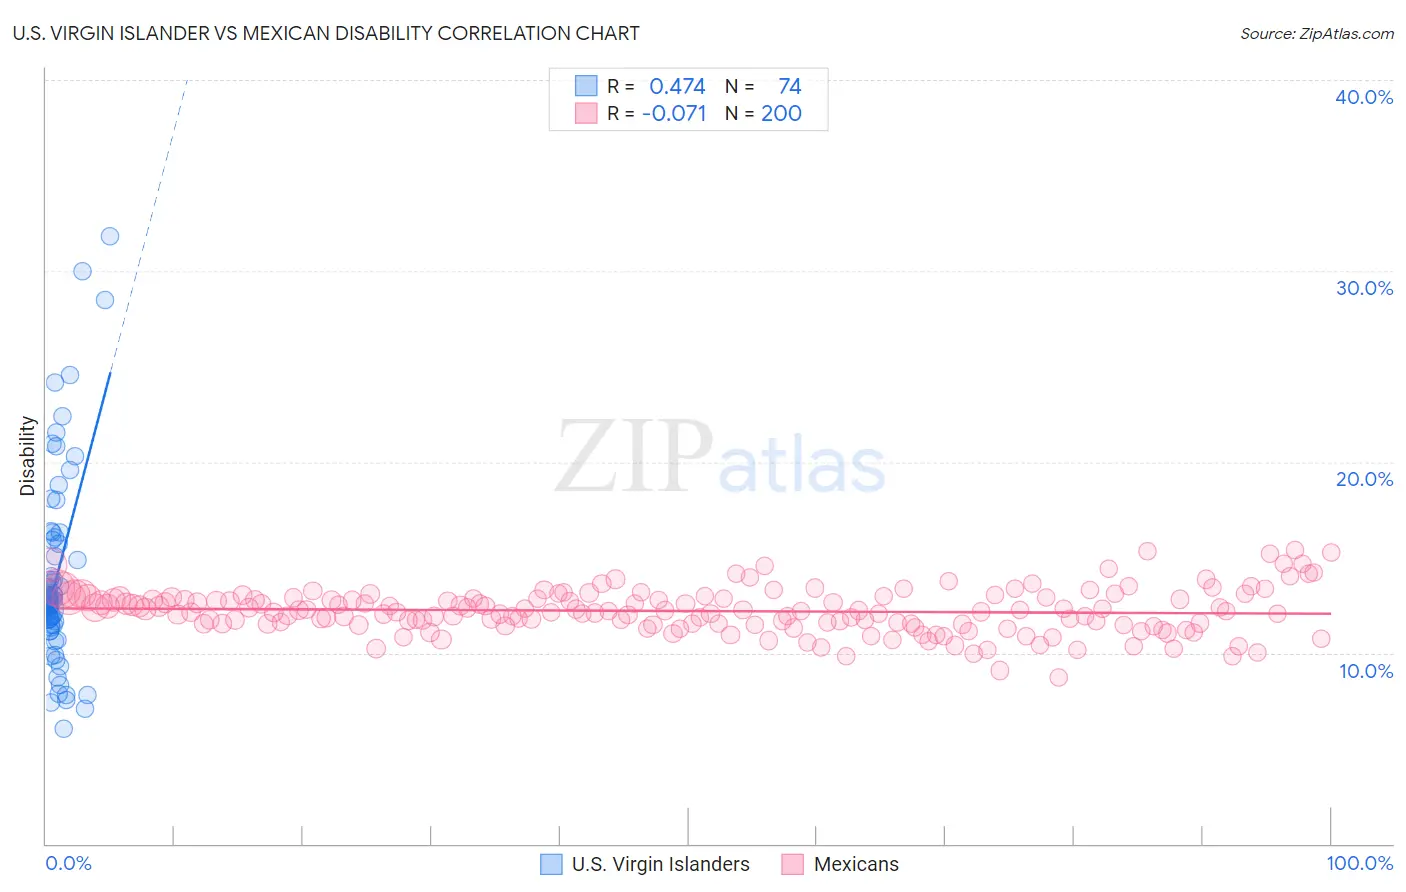
U.S. Virgin Islander vs Mexican Disability Correlation Chart
The statistical analysis conducted on geographies consisting of 87,526,071 people shows a moderate positive correlation between the proportion of U.S. Virgin Islanders and percentage of population with a disability in the United States with a correlation coefficient (R) of 0.474 and weighted average of 12.5%. Similarly, the statistical analysis conducted on geographies consisting of 565,156,927 people shows a slight negative correlation between the proportion of Mexicans and percentage of population with a disability in the United States with a correlation coefficient (R) of -0.071 and weighted average of 12.1%, a difference of 3.1%.
Disability Correlation Summary
| Measurement | U.S. Virgin Islander | Mexican |
| Minimum | 6.0% | 8.7% |
| Maximum | 31.8% | 15.4% |
| Range | 25.8% | 6.7% |
| Mean | 14.0% | 12.2% |
| Median | 12.8% | 12.2% |
| Interquartile 25% (IQ1) | 11.5% | 11.5% |
| Interquartile 75% (IQ3) | 15.9% | 12.9% |
| Interquartile Range (IQR) | 4.5% | 1.3% |
| Standard Deviation (Sample) | 5.2% | 1.2% |
| Standard Deviation (Population) | 5.1% | 1.2% |
Similar Demographics by Disability
Demographics Similar to U.S. Virgin Islanders by Disability
In terms of disability, the demographic groups most similar to U.S. Virgin Islanders are Immigrants from Germany (12.5%, a difference of 0.020%), Hawaiian (12.5%, a difference of 0.13%), Czechoslovakian (12.5%, a difference of 0.16%), Spaniard (12.5%, a difference of 0.24%), and Native Hawaiian (12.5%, a difference of 0.33%).
| Demographics | Rating | Rank | Disability |
| Slavs | 0.5 /100 | #258 | Tragic 12.4% |
| Canadians | 0.4 /100 | #259 | Tragic 12.4% |
| Immigrants | Liberia | 0.4 /100 | #260 | Tragic 12.4% |
| Scandinavians | 0.4 /100 | #261 | Tragic 12.4% |
| Native Hawaiians | 0.3 /100 | #262 | Tragic 12.5% |
| Hawaiians | 0.2 /100 | #263 | Tragic 12.5% |
| Immigrants | Germany | 0.2 /100 | #264 | Tragic 12.5% |
| U.S. Virgin Islanders | 0.2 /100 | #265 | Tragic 12.5% |
| Czechoslovakians | 0.2 /100 | #266 | Tragic 12.5% |
| Spaniards | 0.2 /100 | #267 | Tragic 12.5% |
| Bangladeshis | 0.1 /100 | #268 | Tragic 12.6% |
| Immigrants | Dominican Republic | 0.1 /100 | #269 | Tragic 12.6% |
| Portuguese | 0.1 /100 | #270 | Tragic 12.6% |
| Immigrants | Yemen | 0.1 /100 | #271 | Tragic 12.6% |
| Dominicans | 0.0 /100 | #272 | Tragic 12.7% |
Demographics Similar to Mexicans by Disability
In terms of disability, the demographic groups most similar to Mexicans are Hispanic or Latino (12.1%, a difference of 0.060%), Senegalese (12.1%, a difference of 0.080%), Spanish American Indian (12.1%, a difference of 0.10%), Jamaican (12.1%, a difference of 0.13%), and Northern European (12.1%, a difference of 0.14%).
| Demographics | Rating | Rank | Disability |
| Immigrants | North America | 5.3 /100 | #217 | Tragic 12.1% |
| Immigrants | Jamaica | 5.0 /100 | #218 | Tragic 12.1% |
| Croatians | 4.9 /100 | #219 | Tragic 12.1% |
| Immigrants | Bahamas | 4.7 /100 | #220 | Tragic 12.1% |
| Northern Europeans | 4.2 /100 | #221 | Tragic 12.1% |
| Spanish American Indians | 4.1 /100 | #222 | Tragic 12.1% |
| Hispanics or Latinos | 3.9 /100 | #223 | Tragic 12.1% |
| Mexicans | 3.7 /100 | #224 | Tragic 12.1% |
| Senegalese | 3.5 /100 | #225 | Tragic 12.1% |
| Jamaicans | 3.3 /100 | #226 | Tragic 12.1% |
| Alsatians | 3.3 /100 | #227 | Tragic 12.1% |
| West Indians | 2.9 /100 | #228 | Tragic 12.2% |
| Inupiat | 2.8 /100 | #229 | Tragic 12.2% |
| Samoans | 2.6 /100 | #230 | Tragic 12.2% |
| Malaysians | 2.5 /100 | #231 | Tragic 12.2% |