Immigrants from North Macedonia vs Mexican Disability
COMPARE
Immigrants from North Macedonia
Mexican
Disability
Disability Comparison
Immigrants from North Macedonia
Mexicans
11.4%
DISABILITY
93.5/ 100
METRIC RATING
120th/ 347
METRIC RANK
12.1%
DISABILITY
3.7/ 100
METRIC RATING
224th/ 347
METRIC RANK
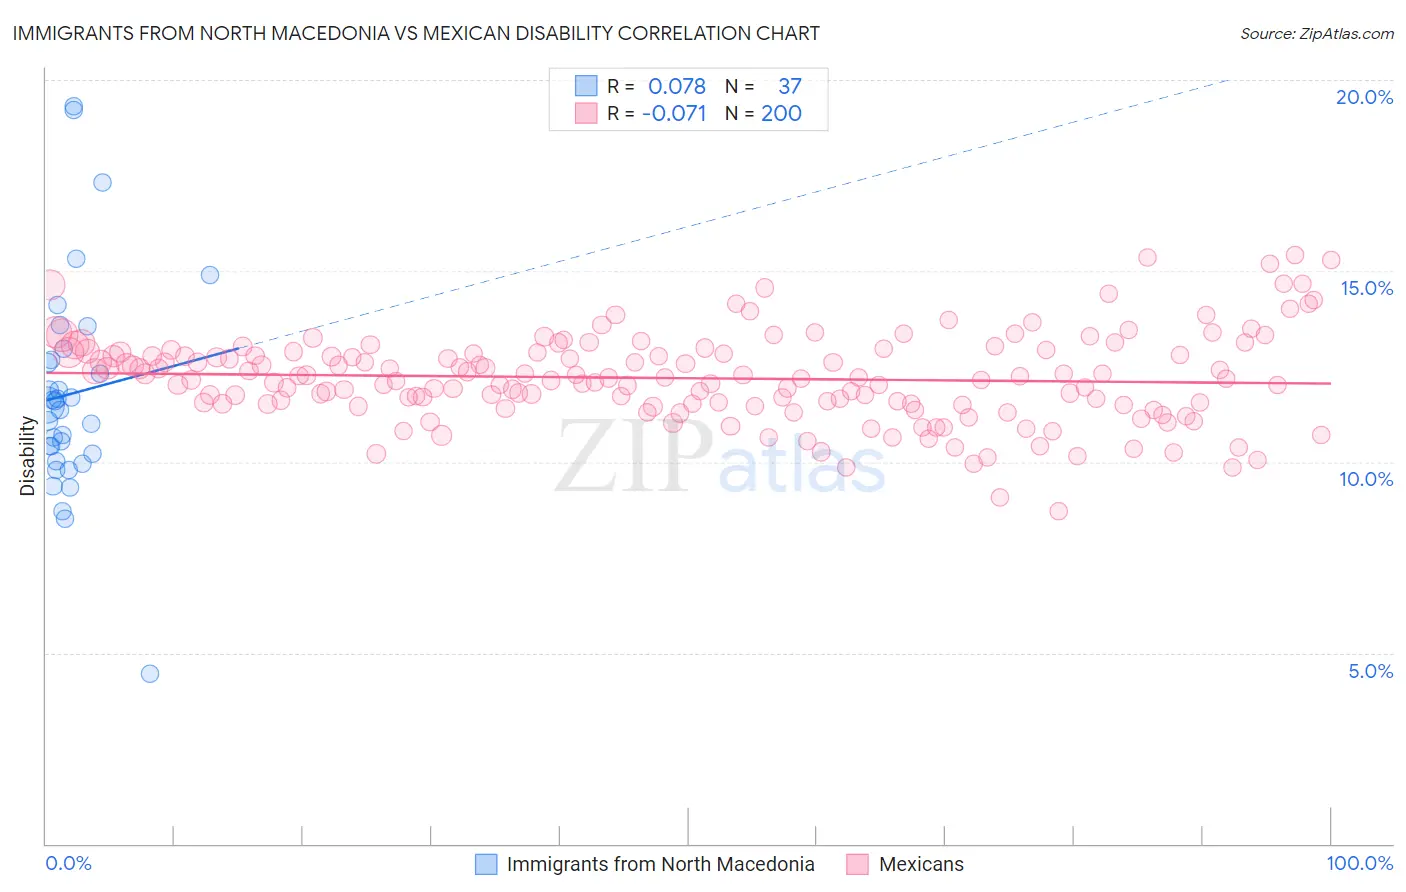
Immigrants from North Macedonia vs Mexican Disability Correlation Chart
The statistical analysis conducted on geographies consisting of 74,314,151 people shows a slight positive correlation between the proportion of Immigrants from North Macedonia and percentage of population with a disability in the United States with a correlation coefficient (R) of 0.078 and weighted average of 11.4%. Similarly, the statistical analysis conducted on geographies consisting of 565,156,927 people shows a slight negative correlation between the proportion of Mexicans and percentage of population with a disability in the United States with a correlation coefficient (R) of -0.071 and weighted average of 12.1%, a difference of 6.8%.
Disability Correlation Summary
| Measurement | Immigrants from North Macedonia | Mexican |
| Minimum | 4.5% | 8.7% |
| Maximum | 19.3% | 15.4% |
| Range | 14.8% | 6.7% |
| Mean | 11.8% | 12.2% |
| Median | 11.5% | 12.2% |
| Interquartile 25% (IQ1) | 10.1% | 11.5% |
| Interquartile 75% (IQ3) | 12.8% | 12.9% |
| Interquartile Range (IQR) | 2.7% | 1.3% |
| Standard Deviation (Sample) | 2.8% | 1.2% |
| Standard Deviation (Population) | 2.8% | 1.2% |
Similar Demographics by Disability
Demographics Similar to Immigrants from North Macedonia by Disability
In terms of disability, the demographic groups most similar to Immigrants from North Macedonia are Central American (11.4%, a difference of 0.0%), Immigrants from Costa Rica (11.4%, a difference of 0.010%), Brazilian (11.4%, a difference of 0.030%), Korean (11.3%, a difference of 0.060%), and Luxembourger (11.3%, a difference of 0.070%).
| Demographics | Rating | Rank | Disability |
| Guyanese | 94.7 /100 | #113 | Exceptional 11.3% |
| Immigrants | Syria | 94.7 /100 | #114 | Exceptional 11.3% |
| Immigrants | Philippines | 94.6 /100 | #115 | Exceptional 11.3% |
| Immigrants | Northern Europe | 94.1 /100 | #116 | Exceptional 11.3% |
| Luxembourgers | 93.9 /100 | #117 | Exceptional 11.3% |
| Koreans | 93.8 /100 | #118 | Exceptional 11.3% |
| Central Americans | 93.5 /100 | #119 | Exceptional 11.4% |
| Immigrants | North Macedonia | 93.5 /100 | #120 | Exceptional 11.4% |
| Immigrants | Costa Rica | 93.4 /100 | #121 | Exceptional 11.4% |
| Brazilians | 93.3 /100 | #122 | Exceptional 11.4% |
| South Africans | 92.3 /100 | #123 | Exceptional 11.4% |
| South American Indians | 92.2 /100 | #124 | Exceptional 11.4% |
| Costa Ricans | 91.9 /100 | #125 | Exceptional 11.4% |
| Immigrants | Latvia | 90.9 /100 | #126 | Exceptional 11.4% |
| Immigrants | Italy | 90.4 /100 | #127 | Exceptional 11.4% |
Demographics Similar to Mexicans by Disability
In terms of disability, the demographic groups most similar to Mexicans are Hispanic or Latino (12.1%, a difference of 0.060%), Senegalese (12.1%, a difference of 0.080%), Spanish American Indian (12.1%, a difference of 0.10%), Jamaican (12.1%, a difference of 0.13%), and Northern European (12.1%, a difference of 0.14%).
| Demographics | Rating | Rank | Disability |
| Immigrants | North America | 5.3 /100 | #217 | Tragic 12.1% |
| Immigrants | Jamaica | 5.0 /100 | #218 | Tragic 12.1% |
| Croatians | 4.9 /100 | #219 | Tragic 12.1% |
| Immigrants | Bahamas | 4.7 /100 | #220 | Tragic 12.1% |
| Northern Europeans | 4.2 /100 | #221 | Tragic 12.1% |
| Spanish American Indians | 4.1 /100 | #222 | Tragic 12.1% |
| Hispanics or Latinos | 3.9 /100 | #223 | Tragic 12.1% |
| Mexicans | 3.7 /100 | #224 | Tragic 12.1% |
| Senegalese | 3.5 /100 | #225 | Tragic 12.1% |
| Jamaicans | 3.3 /100 | #226 | Tragic 12.1% |
| Alsatians | 3.3 /100 | #227 | Tragic 12.1% |
| West Indians | 2.9 /100 | #228 | Tragic 12.2% |
| Inupiat | 2.8 /100 | #229 | Tragic 12.2% |
| Samoans | 2.6 /100 | #230 | Tragic 12.2% |
| Malaysians | 2.5 /100 | #231 | Tragic 12.2% |