Immigrants from Netherlands vs Immigrants from Norway Ambulatory Disability
COMPARE
Immigrants from Netherlands
Immigrants from Norway
Ambulatory Disability
Ambulatory Disability Comparison
Immigrants from Netherlands
Immigrants from Norway
5.8%
AMBULATORY DISABILITY
97.1/ 100
METRIC RATING
109th/ 347
METRIC RANK
5.9%
AMBULATORY DISABILITY
90.5/ 100
METRIC RATING
129th/ 347
METRIC RANK
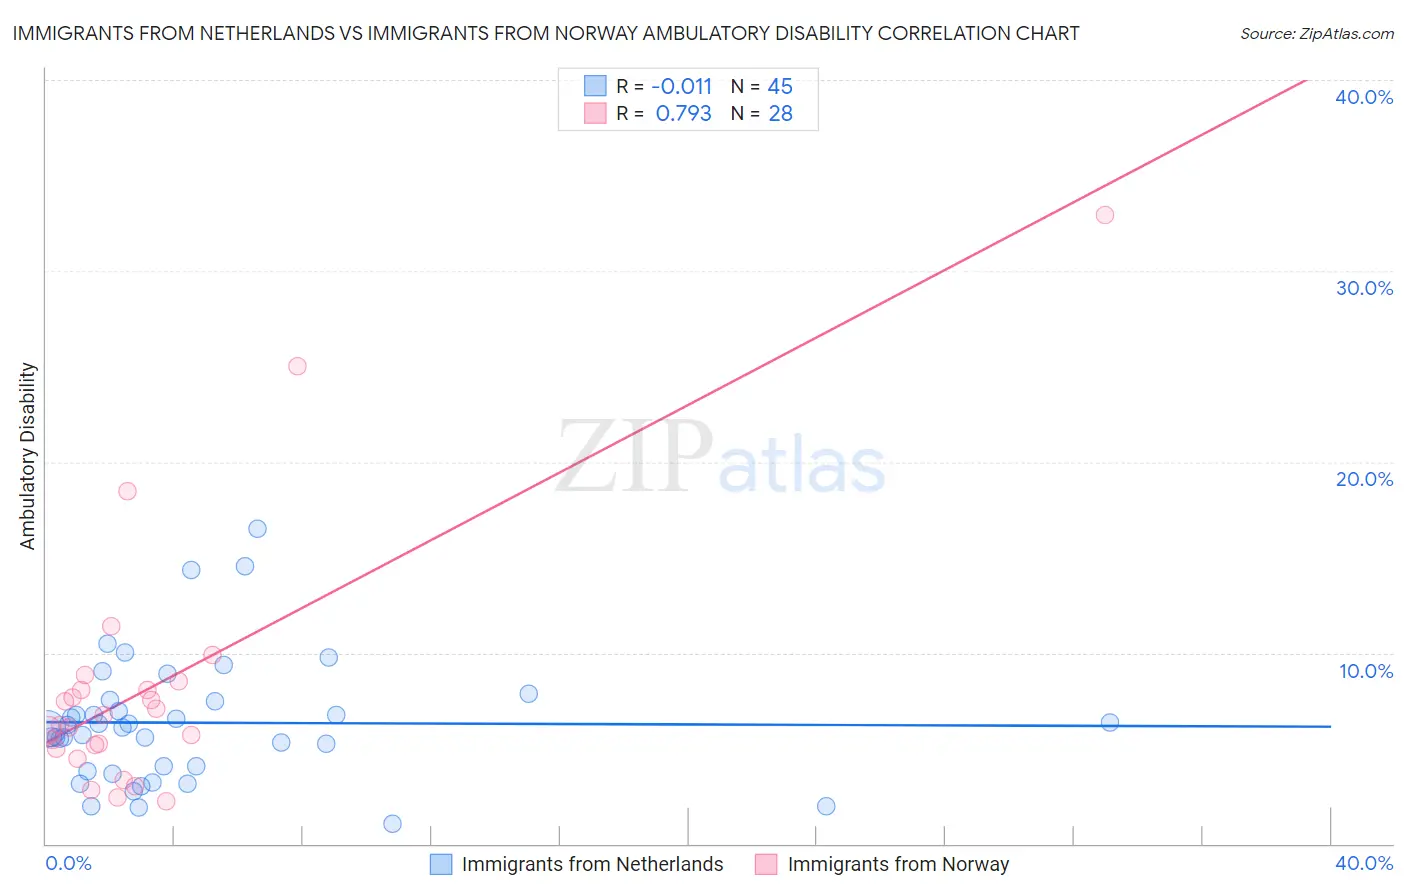
Immigrants from Netherlands vs Immigrants from Norway Ambulatory Disability Correlation Chart
The statistical analysis conducted on geographies consisting of 237,838,654 people shows no correlation between the proportion of Immigrants from Netherlands and percentage of population with ambulatory disability in the United States with a correlation coefficient (R) of -0.011 and weighted average of 5.8%. Similarly, the statistical analysis conducted on geographies consisting of 116,699,496 people shows a strong positive correlation between the proportion of Immigrants from Norway and percentage of population with ambulatory disability in the United States with a correlation coefficient (R) of 0.793 and weighted average of 5.9%, a difference of 1.8%.
Ambulatory Disability Correlation Summary
| Measurement | Immigrants from Netherlands | Immigrants from Norway |
| Minimum | 1.1% | 2.3% |
| Maximum | 16.5% | 33.0% |
| Range | 15.5% | 30.7% |
| Mean | 6.3% | 8.2% |
| Median | 6.1% | 6.5% |
| Interquartile 25% (IQ1) | 3.9% | 5.1% |
| Interquartile 75% (IQ3) | 7.5% | 8.3% |
| Interquartile Range (IQR) | 3.6% | 3.2% |
| Standard Deviation (Sample) | 3.3% | 6.8% |
| Standard Deviation (Population) | 3.3% | 6.6% |
Demographics Similar to Immigrants from Netherlands and Immigrants from Norway by Ambulatory Disability
In terms of ambulatory disability, the demographic groups most similar to Immigrants from Netherlands are Immigrants from Colombia (5.8%, a difference of 0.18%), Danish (5.8%, a difference of 0.25%), South African (5.9%, a difference of 0.38%), Immigrants from Uruguay (5.9%, a difference of 0.60%), and Immigrants from Poland (5.9%, a difference of 0.66%). Similarly, the demographic groups most similar to Immigrants from Norway are Immigrants from Western Asia (5.9%, a difference of 0.030%), Immigrants from Nigeria (5.9%, a difference of 0.070%), Arab (5.9%, a difference of 0.17%), Korean (5.9%, a difference of 0.18%), and Immigrants from Middle Africa (5.9%, a difference of 0.31%).
| Demographics | Rating | Rank | Ambulatory Disability |
| Immigrants | Netherlands | 97.1 /100 | #109 | Exceptional 5.8% |
| Immigrants | Colombia | 96.7 /100 | #110 | Exceptional 5.8% |
| Danes | 96.6 /100 | #111 | Exceptional 5.8% |
| South Africans | 96.3 /100 | #112 | Exceptional 5.9% |
| Immigrants | Uruguay | 95.6 /100 | #113 | Exceptional 5.9% |
| Immigrants | Poland | 95.4 /100 | #114 | Exceptional 5.9% |
| South American Indians | 94.8 /100 | #115 | Exceptional 5.9% |
| Immigrants | Africa | 94.7 /100 | #116 | Exceptional 5.9% |
| Immigrants | South Eastern Asia | 93.6 /100 | #117 | Exceptional 5.9% |
| Russians | 93.4 /100 | #118 | Exceptional 5.9% |
| Norwegians | 93.1 /100 | #119 | Exceptional 5.9% |
| Estonians | 92.9 /100 | #120 | Exceptional 5.9% |
| Costa Ricans | 92.6 /100 | #121 | Exceptional 5.9% |
| Icelanders | 92.6 /100 | #122 | Exceptional 5.9% |
| Immigrants | Russia | 92.4 /100 | #123 | Exceptional 5.9% |
| Immigrants | Middle Africa | 92.2 /100 | #124 | Exceptional 5.9% |
| Koreans | 91.6 /100 | #125 | Exceptional 5.9% |
| Arabs | 91.5 /100 | #126 | Exceptional 5.9% |
| Immigrants | Nigeria | 90.9 /100 | #127 | Exceptional 5.9% |
| Immigrants | Western Asia | 90.7 /100 | #128 | Exceptional 5.9% |
| Immigrants | Norway | 90.5 /100 | #129 | Exceptional 5.9% |