Subsaharan African vs Immigrants from Norway Ambulatory Disability
COMPARE
Subsaharan African
Immigrants from Norway
Ambulatory Disability
Ambulatory Disability Comparison
Sub-Saharan Africans
Immigrants from Norway
6.4%
AMBULATORY DISABILITY
2.3/ 100
METRIC RATING
233rd/ 347
METRIC RANK
5.9%
AMBULATORY DISABILITY
90.5/ 100
METRIC RATING
129th/ 347
METRIC RANK
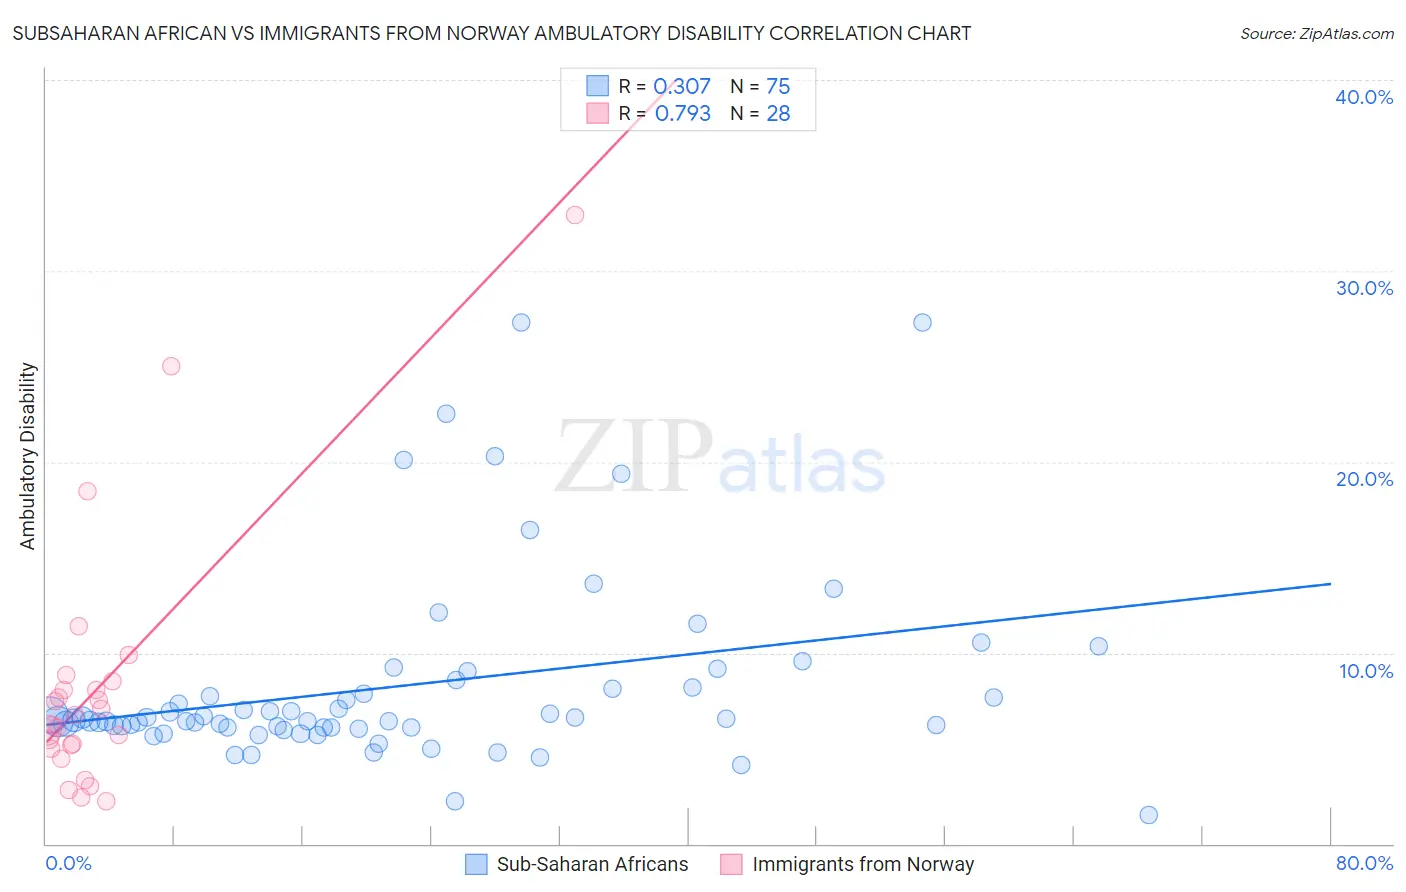
Subsaharan African vs Immigrants from Norway Ambulatory Disability Correlation Chart
The statistical analysis conducted on geographies consisting of 507,846,771 people shows a mild positive correlation between the proportion of Sub-Saharan Africans and percentage of population with ambulatory disability in the United States with a correlation coefficient (R) of 0.307 and weighted average of 6.4%. Similarly, the statistical analysis conducted on geographies consisting of 116,699,496 people shows a strong positive correlation between the proportion of Immigrants from Norway and percentage of population with ambulatory disability in the United States with a correlation coefficient (R) of 0.793 and weighted average of 5.9%, a difference of 8.2%.
Ambulatory Disability Correlation Summary
| Measurement | Subsaharan African | Immigrants from Norway |
| Minimum | 1.5% | 2.3% |
| Maximum | 27.3% | 33.0% |
| Range | 25.7% | 30.7% |
| Mean | 8.3% | 8.2% |
| Median | 6.5% | 6.5% |
| Interquartile 25% (IQ1) | 6.1% | 5.1% |
| Interquartile 75% (IQ3) | 8.2% | 8.3% |
| Interquartile Range (IQR) | 2.1% | 3.2% |
| Standard Deviation (Sample) | 5.0% | 6.8% |
| Standard Deviation (Population) | 4.9% | 6.6% |
Similar Demographics by Ambulatory Disability
Demographics Similar to Sub-Saharan Africans by Ambulatory Disability
In terms of ambulatory disability, the demographic groups most similar to Sub-Saharan Africans are Immigrants from Liberia (6.4%, a difference of 0.030%), Assyrian/Chaldean/Syriac (6.4%, a difference of 0.060%), Hispanic or Latino (6.4%, a difference of 0.060%), Dutch (6.4%, a difference of 0.21%), and Immigrants from Germany (6.4%, a difference of 0.30%).
| Demographics | Rating | Rank | Ambulatory Disability |
| Slavs | 5.1 /100 | #226 | Tragic 6.4% |
| Cubans | 4.0 /100 | #227 | Tragic 6.4% |
| Portuguese | 4.0 /100 | #228 | Tragic 6.4% |
| Czechoslovakians | 3.8 /100 | #229 | Tragic 6.4% |
| Mexicans | 3.5 /100 | #230 | Tragic 6.4% |
| Panamanians | 3.1 /100 | #231 | Tragic 6.4% |
| Assyrians/Chaldeans/Syriacs | 2.4 /100 | #232 | Tragic 6.4% |
| Sub-Saharan Africans | 2.3 /100 | #233 | Tragic 6.4% |
| Immigrants | Liberia | 2.3 /100 | #234 | Tragic 6.4% |
| Hispanics or Latinos | 2.2 /100 | #235 | Tragic 6.4% |
| Dutch | 2.0 /100 | #236 | Tragic 6.4% |
| Immigrants | Germany | 1.8 /100 | #237 | Tragic 6.4% |
| Haitians | 1.8 /100 | #238 | Tragic 6.4% |
| Senegalese | 1.7 /100 | #239 | Tragic 6.4% |
| Immigrants | Senegal | 1.7 /100 | #240 | Tragic 6.4% |
Demographics Similar to Immigrants from Norway by Ambulatory Disability
In terms of ambulatory disability, the demographic groups most similar to Immigrants from Norway are Immigrants from Western Asia (5.9%, a difference of 0.030%), Immigrants from Nigeria (5.9%, a difference of 0.070%), Immigrants from Kazakhstan (5.9%, a difference of 0.11%), Immigrants from Costa Rica (5.9%, a difference of 0.14%), and Arab (5.9%, a difference of 0.17%).
| Demographics | Rating | Rank | Ambulatory Disability |
| Icelanders | 92.6 /100 | #122 | Exceptional 5.9% |
| Immigrants | Russia | 92.4 /100 | #123 | Exceptional 5.9% |
| Immigrants | Middle Africa | 92.2 /100 | #124 | Exceptional 5.9% |
| Koreans | 91.6 /100 | #125 | Exceptional 5.9% |
| Arabs | 91.5 /100 | #126 | Exceptional 5.9% |
| Immigrants | Nigeria | 90.9 /100 | #127 | Exceptional 5.9% |
| Immigrants | Western Asia | 90.7 /100 | #128 | Exceptional 5.9% |
| Immigrants | Norway | 90.5 /100 | #129 | Exceptional 5.9% |
| Immigrants | Kazakhstan | 89.7 /100 | #130 | Excellent 5.9% |
| Immigrants | Costa Rica | 89.5 /100 | #131 | Excellent 5.9% |
| Immigrants | Europe | 87.8 /100 | #132 | Excellent 6.0% |
| Immigrants | Immigrants | 86.9 /100 | #133 | Excellent 6.0% |
| Ute | 86.6 /100 | #134 | Excellent 6.0% |
| Immigrants | Italy | 85.0 /100 | #135 | Excellent 6.0% |
| Immigrants | North Macedonia | 84.1 /100 | #136 | Excellent 6.0% |