Ugandan vs Immigrants from Africa Hearing Disability
COMPARE
Ugandan
Immigrants from Africa
Hearing Disability
Hearing Disability Comparison
Ugandans
Immigrants from Africa
2.9%
HEARING DISABILITY
85.5/ 100
METRIC RATING
134th/ 347
METRIC RANK
2.7%
HEARING DISABILITY
98.0/ 100
METRIC RATING
68th/ 347
METRIC RANK
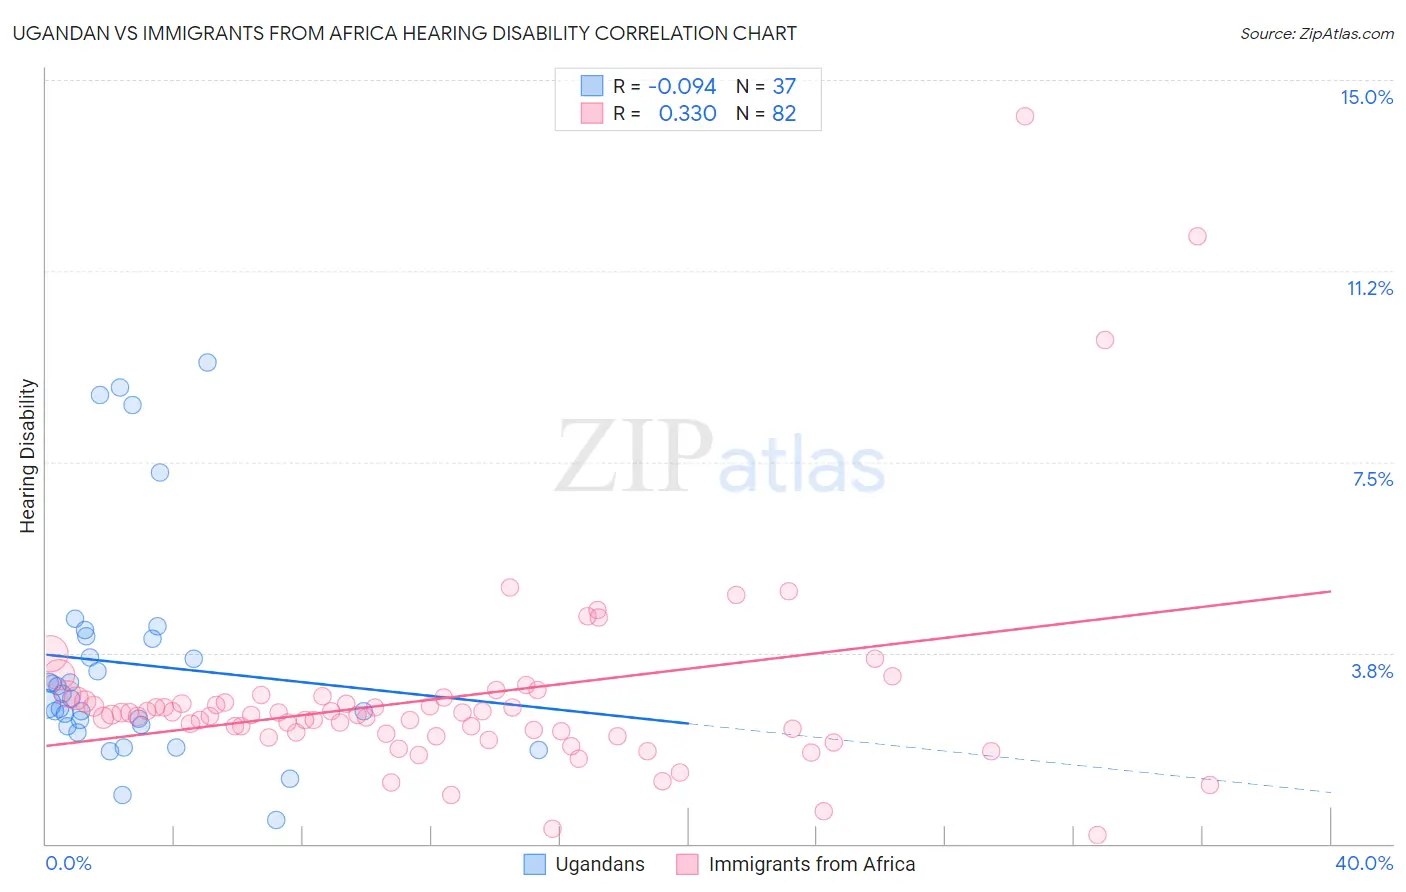
Ugandan vs Immigrants from Africa Hearing Disability Correlation Chart
The statistical analysis conducted on geographies consisting of 94,015,951 people shows a slight negative correlation between the proportion of Ugandans and percentage of population with hearing disability in the United States with a correlation coefficient (R) of -0.094 and weighted average of 2.9%. Similarly, the statistical analysis conducted on geographies consisting of 469,129,407 people shows a mild positive correlation between the proportion of Immigrants from Africa and percentage of population with hearing disability in the United States with a correlation coefficient (R) of 0.330 and weighted average of 2.7%, a difference of 5.4%.
Hearing Disability Correlation Summary
| Measurement | Ugandan | Immigrants from Africa |
| Minimum | 0.45% | 0.17% |
| Maximum | 9.4% | 14.3% |
| Range | 9.0% | 14.1% |
| Mean | 3.5% | 2.9% |
| Median | 2.8% | 2.5% |
| Interquartile 25% (IQ1) | 2.3% | 2.2% |
| Interquartile 75% (IQ3) | 4.1% | 2.9% |
| Interquartile Range (IQR) | 1.7% | 0.70% |
| Standard Deviation (Sample) | 2.2% | 2.0% |
| Standard Deviation (Population) | 2.2% | 2.0% |
Similar Demographics by Hearing Disability
Demographics Similar to Ugandans by Hearing Disability
In terms of hearing disability, the demographic groups most similar to Ugandans are Chilean (2.9%, a difference of 0.070%), Immigrants from Syria (2.9%, a difference of 0.070%), Immigrants from Kenya (2.9%, a difference of 0.13%), Soviet Union (2.9%, a difference of 0.14%), and Immigrants from Brazil (2.9%, a difference of 0.17%).
| Demographics | Rating | Rank | Hearing Disability |
| South American Indians | 86.9 /100 | #127 | Excellent 2.9% |
| Immigrants | Western Asia | 86.9 /100 | #128 | Excellent 2.9% |
| Immigrants | Uganda | 86.6 /100 | #129 | Excellent 2.9% |
| Immigrants | Vietnam | 86.5 /100 | #130 | Excellent 2.9% |
| Immigrants | Kenya | 86.1 /100 | #131 | Excellent 2.9% |
| Chileans | 85.8 /100 | #132 | Excellent 2.9% |
| Immigrants | Syria | 85.8 /100 | #133 | Excellent 2.9% |
| Ugandans | 85.5 /100 | #134 | Excellent 2.9% |
| Soviet Union | 84.8 /100 | #135 | Excellent 2.9% |
| Immigrants | Brazil | 84.6 /100 | #136 | Excellent 2.9% |
| Sri Lankans | 84.1 /100 | #137 | Excellent 2.9% |
| Immigrants | Costa Rica | 84.0 /100 | #138 | Excellent 2.9% |
| Bermudans | 83.8 /100 | #139 | Excellent 2.9% |
| Immigrants | Jordan | 83.7 /100 | #140 | Excellent 2.9% |
| Sub-Saharan Africans | 83.3 /100 | #141 | Excellent 2.9% |
Demographics Similar to Immigrants from Africa by Hearing Disability
In terms of hearing disability, the demographic groups most similar to Immigrants from Africa are Nicaraguan (2.7%, a difference of 0.040%), Egyptian (2.7%, a difference of 0.13%), Peruvian (2.7%, a difference of 0.27%), Central American (2.7%, a difference of 0.32%), and Immigrants from Belize (2.7%, a difference of 0.36%).
| Demographics | Rating | Rank | Hearing Disability |
| Immigrants | Uzbekistan | 98.4 /100 | #61 | Exceptional 2.7% |
| Immigrants | Colombia | 98.4 /100 | #62 | Exceptional 2.7% |
| Indians (Asian) | 98.4 /100 | #63 | Exceptional 2.7% |
| Immigrants | Sri Lanka | 98.4 /100 | #64 | Exceptional 2.7% |
| Immigrants | Nepal | 98.3 /100 | #65 | Exceptional 2.7% |
| Immigrants | Belize | 98.2 /100 | #66 | Exceptional 2.7% |
| Egyptians | 98.1 /100 | #67 | Exceptional 2.7% |
| Immigrants | Africa | 98.0 /100 | #68 | Exceptional 2.7% |
| Nicaraguans | 97.9 /100 | #69 | Exceptional 2.7% |
| Peruvians | 97.7 /100 | #70 | Exceptional 2.7% |
| Central Americans | 97.7 /100 | #71 | Exceptional 2.7% |
| Afghans | 97.6 /100 | #72 | Exceptional 2.7% |
| Argentineans | 97.5 /100 | #73 | Exceptional 2.7% |
| Immigrants | Korea | 97.5 /100 | #74 | Exceptional 2.7% |
| Immigrants | Saudi Arabia | 97.5 /100 | #75 | Exceptional 2.7% |