Ugandan vs Immigrants from Greece Hearing Disability
COMPARE
Ugandan
Immigrants from Greece
Hearing Disability
Hearing Disability Comparison
Ugandans
Immigrants from Greece
2.9%
HEARING DISABILITY
85.5/ 100
METRIC RATING
134th/ 347
METRIC RANK
3.0%
HEARING DISABILITY
57.9/ 100
METRIC RATING
168th/ 347
METRIC RANK
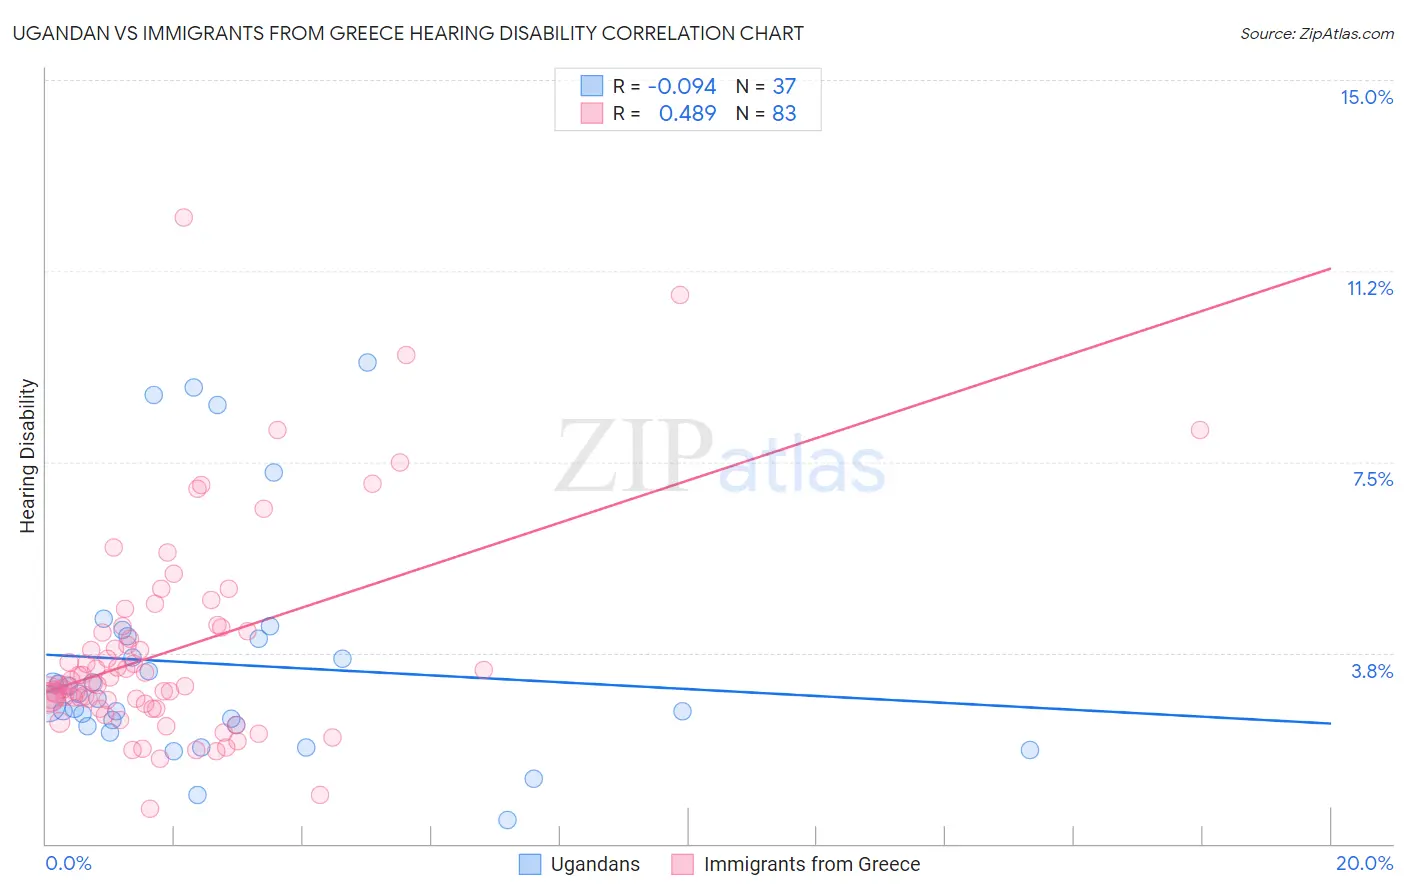
Ugandan vs Immigrants from Greece Hearing Disability Correlation Chart
The statistical analysis conducted on geographies consisting of 94,015,951 people shows a slight negative correlation between the proportion of Ugandans and percentage of population with hearing disability in the United States with a correlation coefficient (R) of -0.094 and weighted average of 2.9%. Similarly, the statistical analysis conducted on geographies consisting of 216,842,518 people shows a moderate positive correlation between the proportion of Immigrants from Greece and percentage of population with hearing disability in the United States with a correlation coefficient (R) of 0.489 and weighted average of 3.0%, a difference of 3.6%.
Hearing Disability Correlation Summary
| Measurement | Ugandan | Immigrants from Greece |
| Minimum | 0.45% | 0.70% |
| Maximum | 9.4% | 12.3% |
| Range | 9.0% | 11.6% |
| Mean | 3.5% | 3.8% |
| Median | 2.8% | 3.2% |
| Interquartile 25% (IQ1) | 2.3% | 2.8% |
| Interquartile 75% (IQ3) | 4.1% | 4.3% |
| Interquartile Range (IQR) | 1.7% | 1.5% |
| Standard Deviation (Sample) | 2.2% | 2.1% |
| Standard Deviation (Population) | 2.2% | 2.0% |
Similar Demographics by Hearing Disability
Demographics Similar to Ugandans by Hearing Disability
In terms of hearing disability, the demographic groups most similar to Ugandans are Chilean (2.9%, a difference of 0.070%), Immigrants from Syria (2.9%, a difference of 0.070%), Immigrants from Kenya (2.9%, a difference of 0.13%), Soviet Union (2.9%, a difference of 0.14%), and Immigrants from Brazil (2.9%, a difference of 0.17%).
| Demographics | Rating | Rank | Hearing Disability |
| South American Indians | 86.9 /100 | #127 | Excellent 2.9% |
| Immigrants | Western Asia | 86.9 /100 | #128 | Excellent 2.9% |
| Immigrants | Uganda | 86.6 /100 | #129 | Excellent 2.9% |
| Immigrants | Vietnam | 86.5 /100 | #130 | Excellent 2.9% |
| Immigrants | Kenya | 86.1 /100 | #131 | Excellent 2.9% |
| Chileans | 85.8 /100 | #132 | Excellent 2.9% |
| Immigrants | Syria | 85.8 /100 | #133 | Excellent 2.9% |
| Ugandans | 85.5 /100 | #134 | Excellent 2.9% |
| Soviet Union | 84.8 /100 | #135 | Excellent 2.9% |
| Immigrants | Brazil | 84.6 /100 | #136 | Excellent 2.9% |
| Sri Lankans | 84.1 /100 | #137 | Excellent 2.9% |
| Immigrants | Costa Rica | 84.0 /100 | #138 | Excellent 2.9% |
| Bermudans | 83.8 /100 | #139 | Excellent 2.9% |
| Immigrants | Jordan | 83.7 /100 | #140 | Excellent 2.9% |
| Sub-Saharan Africans | 83.3 /100 | #141 | Excellent 2.9% |
Demographics Similar to Immigrants from Greece by Hearing Disability
In terms of hearing disability, the demographic groups most similar to Immigrants from Greece are Immigrants from Eastern Europe (3.0%, a difference of 0.020%), Arab (3.0%, a difference of 0.030%), Immigrants from Cabo Verde (3.0%, a difference of 0.10%), Immigrants from Ukraine (3.0%, a difference of 0.12%), and Armenian (3.0%, a difference of 0.18%).
| Demographics | Rating | Rank | Hearing Disability |
| Albanians | 66.6 /100 | #161 | Good 2.9% |
| Immigrants | Japan | 66.3 /100 | #162 | Good 2.9% |
| Immigrants | Central America | 64.9 /100 | #163 | Good 3.0% |
| Immigrants | Cambodia | 64.8 /100 | #164 | Good 3.0% |
| Immigrants | Zimbabwe | 64.2 /100 | #165 | Good 3.0% |
| Immigrants | South Eastern Asia | 62.9 /100 | #166 | Good 3.0% |
| Immigrants | Eastern Europe | 58.1 /100 | #167 | Average 3.0% |
| Immigrants | Greece | 57.9 /100 | #168 | Average 3.0% |
| Arabs | 57.6 /100 | #169 | Average 3.0% |
| Immigrants | Cabo Verde | 56.9 /100 | #170 | Average 3.0% |
| Immigrants | Ukraine | 56.6 /100 | #171 | Average 3.0% |
| Armenians | 56.0 /100 | #172 | Average 3.0% |
| Immigrants | Serbia | 51.1 /100 | #173 | Average 3.0% |
| Indonesians | 50.0 /100 | #174 | Average 3.0% |
| Immigrants | Romania | 48.4 /100 | #175 | Average 3.0% |