Ugandan vs Aleut Hearing Disability
COMPARE
Ugandan
Aleut
Hearing Disability
Hearing Disability Comparison
Ugandans
Aleuts
2.9%
HEARING DISABILITY
85.5/ 100
METRIC RATING
134th/ 347
METRIC RANK
4.3%
HEARING DISABILITY
0.0/ 100
METRIC RATING
334th/ 347
METRIC RANK
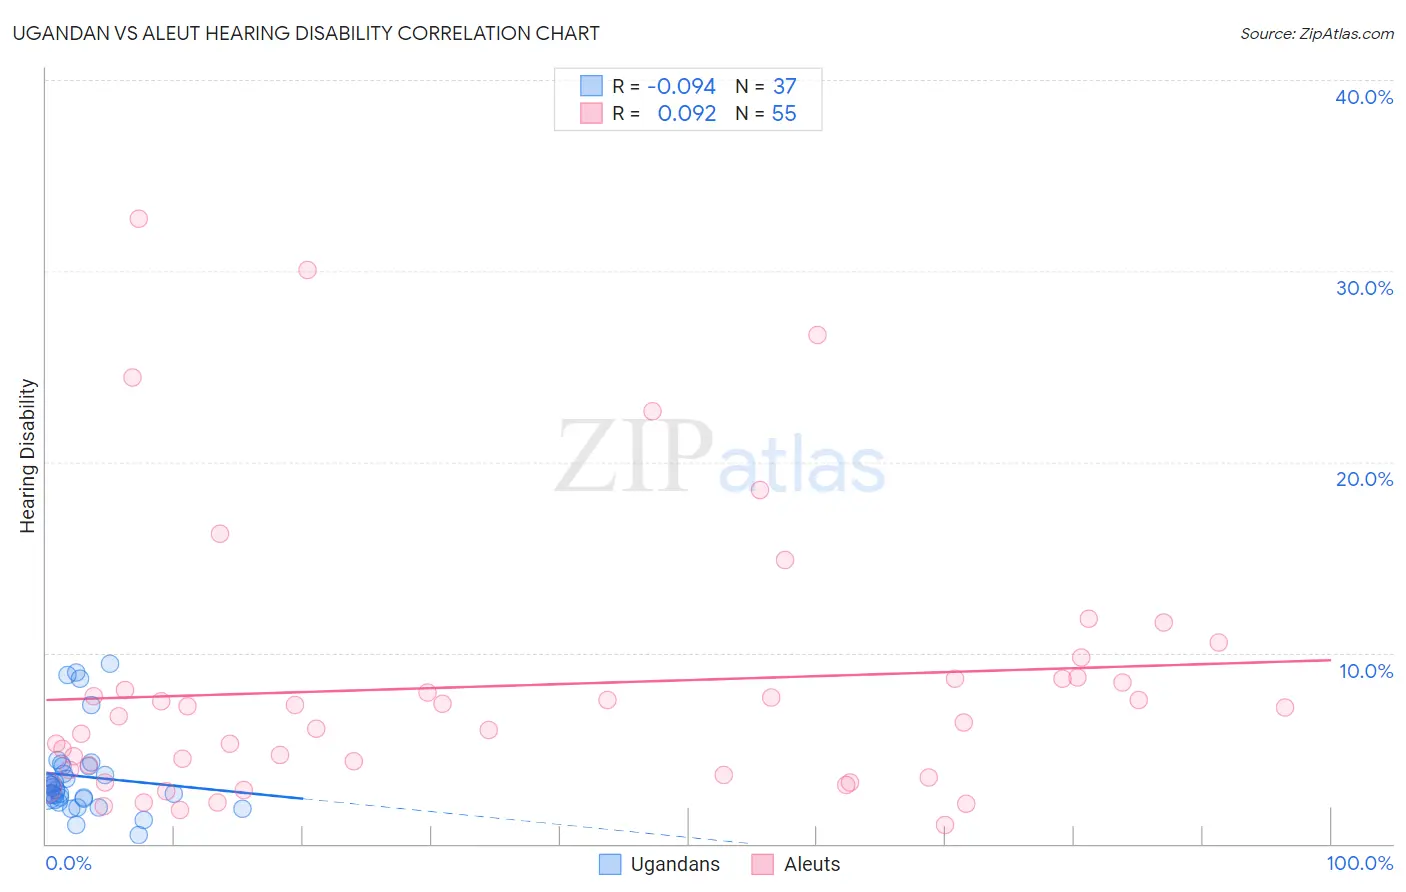
Ugandan vs Aleut Hearing Disability Correlation Chart
The statistical analysis conducted on geographies consisting of 94,015,951 people shows a slight negative correlation between the proportion of Ugandans and percentage of population with hearing disability in the United States with a correlation coefficient (R) of -0.094 and weighted average of 2.9%. Similarly, the statistical analysis conducted on geographies consisting of 61,781,709 people shows a slight positive correlation between the proportion of Aleuts and percentage of population with hearing disability in the United States with a correlation coefficient (R) of 0.092 and weighted average of 4.3%, a difference of 49.1%.
Hearing Disability Correlation Summary
| Measurement | Ugandan | Aleut |
| Minimum | 0.45% | 0.97% |
| Maximum | 9.4% | 32.7% |
| Range | 9.0% | 31.7% |
| Mean | 3.5% | 8.3% |
| Median | 2.8% | 6.7% |
| Interquartile 25% (IQ1) | 2.3% | 3.6% |
| Interquartile 75% (IQ3) | 4.1% | 8.6% |
| Interquartile Range (IQR) | 1.7% | 5.0% |
| Standard Deviation (Sample) | 2.2% | 7.1% |
| Standard Deviation (Population) | 2.2% | 7.1% |
Similar Demographics by Hearing Disability
Demographics Similar to Ugandans by Hearing Disability
In terms of hearing disability, the demographic groups most similar to Ugandans are Chilean (2.9%, a difference of 0.070%), Immigrants from Syria (2.9%, a difference of 0.070%), Immigrants from Kenya (2.9%, a difference of 0.13%), Soviet Union (2.9%, a difference of 0.14%), and Immigrants from Brazil (2.9%, a difference of 0.17%).
| Demographics | Rating | Rank | Hearing Disability |
| South American Indians | 86.9 /100 | #127 | Excellent 2.9% |
| Immigrants | Western Asia | 86.9 /100 | #128 | Excellent 2.9% |
| Immigrants | Uganda | 86.6 /100 | #129 | Excellent 2.9% |
| Immigrants | Vietnam | 86.5 /100 | #130 | Excellent 2.9% |
| Immigrants | Kenya | 86.1 /100 | #131 | Excellent 2.9% |
| Chileans | 85.8 /100 | #132 | Excellent 2.9% |
| Immigrants | Syria | 85.8 /100 | #133 | Excellent 2.9% |
| Ugandans | 85.5 /100 | #134 | Excellent 2.9% |
| Soviet Union | 84.8 /100 | #135 | Excellent 2.9% |
| Immigrants | Brazil | 84.6 /100 | #136 | Excellent 2.9% |
| Sri Lankans | 84.1 /100 | #137 | Excellent 2.9% |
| Immigrants | Costa Rica | 84.0 /100 | #138 | Excellent 2.9% |
| Bermudans | 83.8 /100 | #139 | Excellent 2.9% |
| Immigrants | Jordan | 83.7 /100 | #140 | Excellent 2.9% |
| Sub-Saharan Africans | 83.3 /100 | #141 | Excellent 2.9% |
Demographics Similar to Aleuts by Hearing Disability
In terms of hearing disability, the demographic groups most similar to Aleuts are Dutch West Indian (4.3%, a difference of 0.54%), Houma (4.2%, a difference of 1.1%), Kiowa (4.3%, a difference of 1.3%), Cherokee (4.2%, a difference of 1.8%), and Native/Alaskan (4.2%, a difference of 2.0%).
| Demographics | Rating | Rank | Hearing Disability |
| Arapaho | 0.0 /100 | #327 | Tragic 4.1% |
| Tohono O'odham | 0.0 /100 | #328 | Tragic 4.2% |
| Crow | 0.0 /100 | #329 | Tragic 4.2% |
| Natives/Alaskans | 0.0 /100 | #330 | Tragic 4.2% |
| Cherokee | 0.0 /100 | #331 | Tragic 4.2% |
| Houma | 0.0 /100 | #332 | Tragic 4.2% |
| Dutch West Indians | 0.0 /100 | #333 | Tragic 4.3% |
| Aleuts | 0.0 /100 | #334 | Tragic 4.3% |
| Kiowa | 0.0 /100 | #335 | Tragic 4.3% |
| Creek | 0.0 /100 | #336 | Tragic 4.4% |
| Chickasaw | 0.0 /100 | #337 | Tragic 4.5% |
| Alaska Natives | 0.0 /100 | #338 | Tragic 4.5% |
| Choctaw | 0.0 /100 | #339 | Tragic 4.5% |
| Pueblo | 0.0 /100 | #340 | Tragic 4.6% |
| Navajo | 0.0 /100 | #341 | Tragic 4.6% |