Ugandan vs Sioux Unemployment Among Youth under 25 years
COMPARE
Ugandan
Sioux
Unemployment Among Youth under 25 years
Unemployment Among Youth under 25 years Comparison
Ugandans
Sioux
11.6%
UNEMPLOYMENT AMONG YOUTH UNDER 25 YEARS
45.6/ 100
METRIC RATING
176th/ 347
METRIC RANK
14.4%
UNEMPLOYMENT AMONG YOUTH UNDER 25 YEARS
0.0/ 100
METRIC RATING
315th/ 347
METRIC RANK
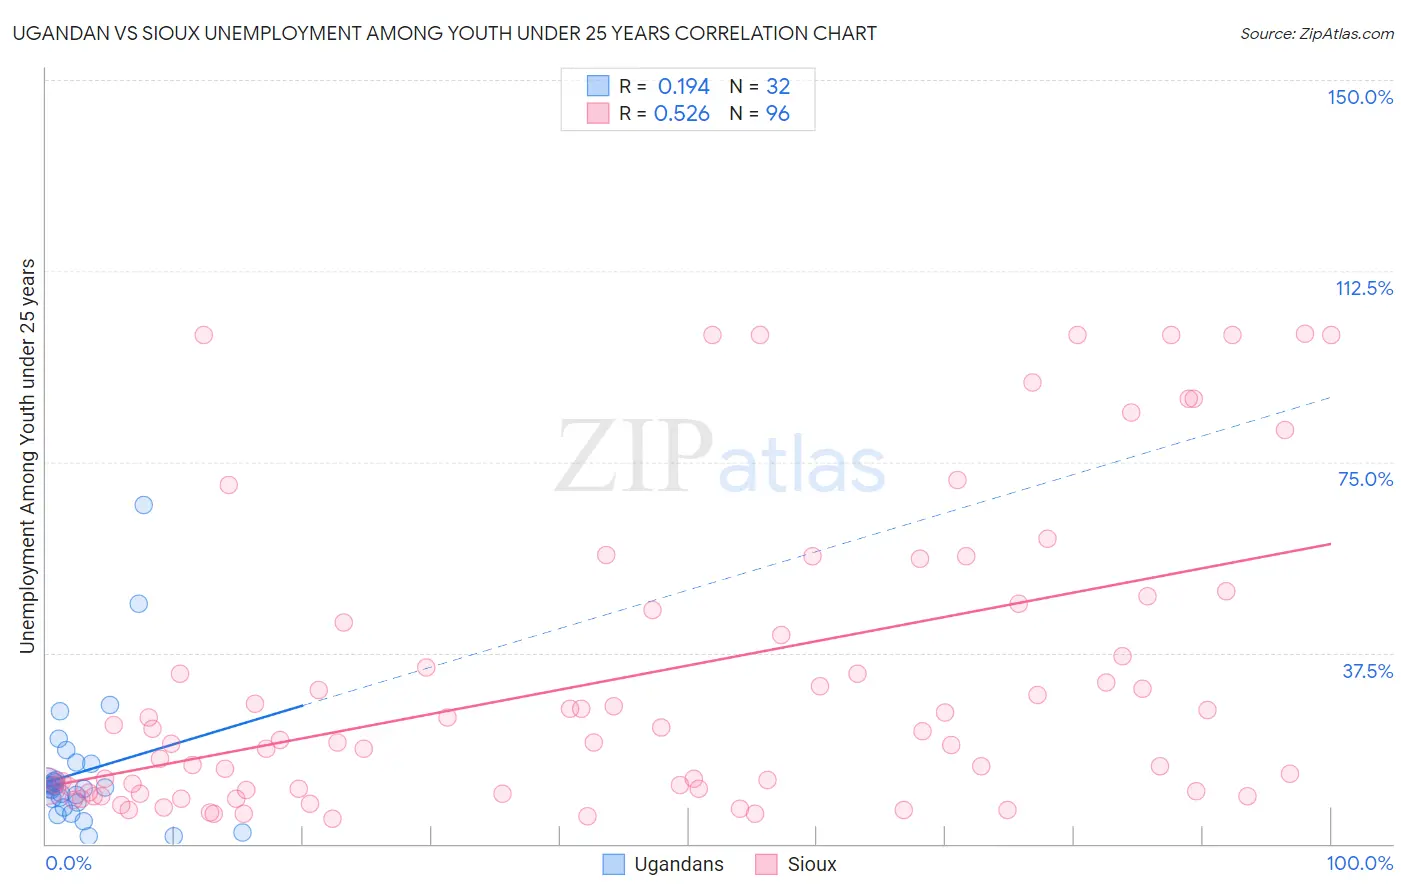
Ugandan vs Sioux Unemployment Among Youth under 25 years Correlation Chart
The statistical analysis conducted on geographies consisting of 93,873,429 people shows a poor positive correlation between the proportion of Ugandans and unemployment rate among youth under the age of 25 in the United States with a correlation coefficient (R) of 0.194 and weighted average of 11.6%. Similarly, the statistical analysis conducted on geographies consisting of 231,304,612 people shows a substantial positive correlation between the proportion of Sioux and unemployment rate among youth under the age of 25 in the United States with a correlation coefficient (R) of 0.526 and weighted average of 14.4%, a difference of 23.9%.
Unemployment Among Youth under 25 years Correlation Summary
| Measurement | Ugandan | Sioux |
| Minimum | 1.4% | 4.9% |
| Maximum | 66.6% | 100.1% |
| Range | 65.2% | 95.2% |
| Mean | 14.0% | 32.1% |
| Median | 11.2% | 20.2% |
| Interquartile 25% (IQ1) | 8.6% | 10.5% |
| Interquartile 75% (IQ3) | 14.1% | 44.7% |
| Interquartile Range (IQR) | 5.5% | 34.2% |
| Standard Deviation (Sample) | 12.9% | 29.3% |
| Standard Deviation (Population) | 12.7% | 29.2% |
Similar Demographics by Unemployment Among Youth under 25 years
Demographics Similar to Ugandans by Unemployment Among Youth under 25 years
In terms of unemployment among youth under 25 years, the demographic groups most similar to Ugandans are Immigrants from Denmark (11.6%, a difference of 0.030%), Immigrants from Iraq (11.6%, a difference of 0.060%), Immigrants from Europe (11.6%, a difference of 0.13%), Immigrants from Hong Kong (11.6%, a difference of 0.13%), and Immigrants from China (11.6%, a difference of 0.18%).
| Demographics | Rating | Rank | Unemployment Among Youth under 25 years |
| Eastern Europeans | 57.5 /100 | #169 | Average 11.6% |
| Russians | 57.3 /100 | #170 | Average 11.6% |
| Bangladeshis | 55.6 /100 | #171 | Average 11.6% |
| Immigrants | Morocco | 55.1 /100 | #172 | Average 11.6% |
| Immigrants | South Eastern Asia | 51.7 /100 | #173 | Average 11.6% |
| Immigrants | China | 50.0 /100 | #174 | Average 11.6% |
| Immigrants | Iraq | 47.0 /100 | #175 | Average 11.6% |
| Ugandans | 45.6 /100 | #176 | Average 11.6% |
| Immigrants | Denmark | 45.0 /100 | #177 | Average 11.6% |
| Immigrants | Europe | 42.4 /100 | #178 | Average 11.6% |
| Immigrants | Hong Kong | 42.4 /100 | #179 | Average 11.6% |
| Spaniards | 39.8 /100 | #180 | Fair 11.7% |
| Syrians | 38.4 /100 | #181 | Fair 11.7% |
| Immigrants | Italy | 36.2 /100 | #182 | Fair 11.7% |
| Americans | 34.5 /100 | #183 | Fair 11.7% |
Demographics Similar to Sioux by Unemployment Among Youth under 25 years
In terms of unemployment among youth under 25 years, the demographic groups most similar to Sioux are Jamaican (14.4%, a difference of 0.11%), Immigrants from Armenia (14.4%, a difference of 0.20%), Native/Alaskan (14.5%, a difference of 0.42%), Black/African American (14.5%, a difference of 0.51%), and Vietnamese (14.3%, a difference of 1.0%).
| Demographics | Rating | Rank | Unemployment Among Youth under 25 years |
| Immigrants | Belize | 0.0 /100 | #308 | Tragic 14.0% |
| Aleuts | 0.0 /100 | #309 | Tragic 14.1% |
| Immigrants | West Indies | 0.0 /100 | #310 | Tragic 14.2% |
| Immigrants | Bangladesh | 0.0 /100 | #311 | Tragic 14.2% |
| Vietnamese | 0.0 /100 | #312 | Tragic 14.3% |
| Immigrants | Armenia | 0.0 /100 | #313 | Tragic 14.4% |
| Jamaicans | 0.0 /100 | #314 | Tragic 14.4% |
| Sioux | 0.0 /100 | #315 | Tragic 14.4% |
| Natives/Alaskans | 0.0 /100 | #316 | Tragic 14.5% |
| Blacks/African Americans | 0.0 /100 | #317 | Tragic 14.5% |
| Immigrants | Dominica | 0.0 /100 | #318 | Tragic 14.6% |
| West Indians | 0.0 /100 | #319 | Tragic 14.6% |
| Barbadians | 0.0 /100 | #320 | Tragic 14.6% |
| Cheyenne | 0.0 /100 | #321 | Tragic 14.6% |
| Trinidadians and Tobagonians | 0.0 /100 | #322 | Tragic 14.6% |