Turkish vs Hopi Ambulatory Disability
COMPARE
Turkish
Hopi
Ambulatory Disability
Ambulatory Disability Comparison
Turks
Hopi
5.5%
AMBULATORY DISABILITY
100.0/ 100
METRIC RATING
37th/ 347
METRIC RANK
7.6%
AMBULATORY DISABILITY
0.0/ 100
METRIC RATING
328th/ 347
METRIC RANK
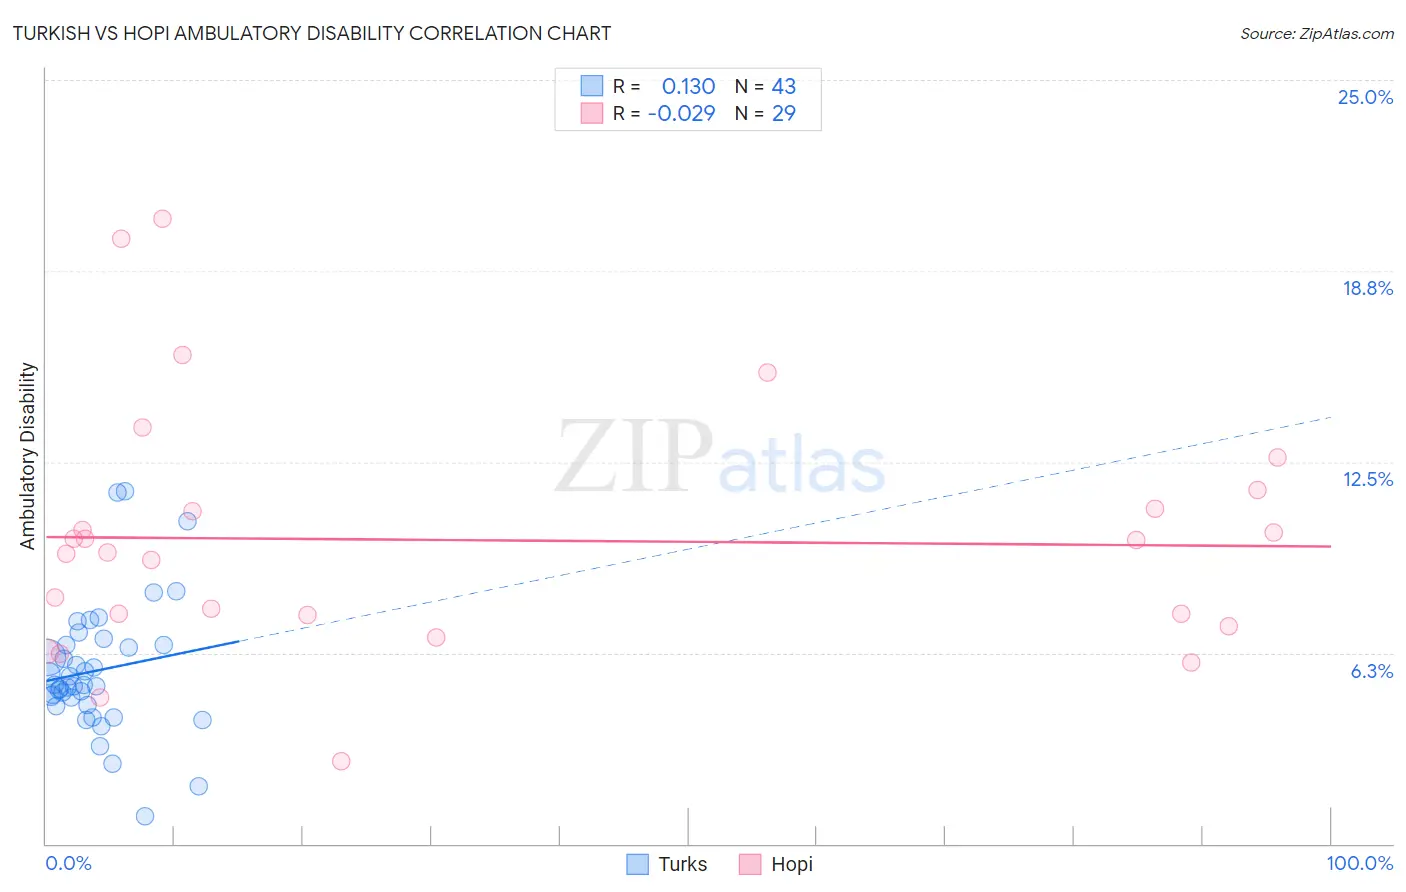
Turkish vs Hopi Ambulatory Disability Correlation Chart
The statistical analysis conducted on geographies consisting of 271,801,732 people shows a poor positive correlation between the proportion of Turks and percentage of population with ambulatory disability in the United States with a correlation coefficient (R) of 0.130 and weighted average of 5.5%. Similarly, the statistical analysis conducted on geographies consisting of 74,727,187 people shows no correlation between the proportion of Hopi and percentage of population with ambulatory disability in the United States with a correlation coefficient (R) of -0.029 and weighted average of 7.6%, a difference of 38.6%.
Ambulatory Disability Correlation Summary
| Measurement | Turkish | Hopi |
| Minimum | 0.92% | 2.7% |
| Maximum | 11.5% | 20.4% |
| Range | 10.6% | 17.7% |
| Mean | 5.7% | 9.9% |
| Median | 5.2% | 9.5% |
| Interquartile 25% (IQ1) | 4.5% | 7.3% |
| Interquartile 75% (IQ3) | 6.5% | 11.3% |
| Interquartile Range (IQR) | 2.0% | 4.0% |
| Standard Deviation (Sample) | 2.1% | 4.1% |
| Standard Deviation (Population) | 2.1% | 4.0% |
Similar Demographics by Ambulatory Disability
Demographics Similar to Turks by Ambulatory Disability
In terms of ambulatory disability, the demographic groups most similar to Turks are Cypriot (5.5%, a difference of 0.010%), Immigrants from Malaysia (5.5%, a difference of 0.020%), Afghan (5.5%, a difference of 0.080%), Immigrants from Eritrea (5.5%, a difference of 0.090%), and Immigrants from Asia (5.5%, a difference of 0.13%).
| Demographics | Rating | Rank | Ambulatory Disability |
| Immigrants | Turkey | 100.0 /100 | #30 | Exceptional 5.4% |
| Immigrants | Venezuela | 100.0 /100 | #31 | Exceptional 5.4% |
| Immigrants | Australia | 100.0 /100 | #32 | Exceptional 5.5% |
| Immigrants | Pakistan | 100.0 /100 | #33 | Exceptional 5.5% |
| Immigrants | Asia | 100.0 /100 | #34 | Exceptional 5.5% |
| Afghans | 100.0 /100 | #35 | Exceptional 5.5% |
| Immigrants | Malaysia | 100.0 /100 | #36 | Exceptional 5.5% |
| Turks | 100.0 /100 | #37 | Exceptional 5.5% |
| Cypriots | 100.0 /100 | #38 | Exceptional 5.5% |
| Immigrants | Eritrea | 100.0 /100 | #39 | Exceptional 5.5% |
| Venezuelans | 99.9 /100 | #40 | Exceptional 5.5% |
| Mongolians | 99.9 /100 | #41 | Exceptional 5.5% |
| Argentineans | 99.9 /100 | #42 | Exceptional 5.5% |
| Paraguayans | 99.9 /100 | #43 | Exceptional 5.5% |
| Immigrants | Indonesia | 99.9 /100 | #44 | Exceptional 5.5% |
Demographics Similar to Hopi by Ambulatory Disability
In terms of ambulatory disability, the demographic groups most similar to Hopi are Pueblo (7.6%, a difference of 0.040%), Native/Alaskan (7.5%, a difference of 0.94%), Black/African American (7.5%, a difference of 0.95%), Comanche (7.5%, a difference of 1.1%), and Navajo (7.5%, a difference of 1.1%).
| Demographics | Rating | Rank | Ambulatory Disability |
| Apache | 0.0 /100 | #321 | Tragic 7.4% |
| Osage | 0.0 /100 | #322 | Tragic 7.4% |
| Americans | 0.0 /100 | #323 | Tragic 7.4% |
| Navajo | 0.0 /100 | #324 | Tragic 7.5% |
| Comanche | 0.0 /100 | #325 | Tragic 7.5% |
| Blacks/African Americans | 0.0 /100 | #326 | Tragic 7.5% |
| Natives/Alaskans | 0.0 /100 | #327 | Tragic 7.5% |
| Hopi | 0.0 /100 | #328 | Tragic 7.6% |
| Pueblo | 0.0 /100 | #329 | Tragic 7.6% |
| Paiute | 0.0 /100 | #330 | Tragic 7.7% |
| Cajuns | 0.0 /100 | #331 | Tragic 7.8% |
| Menominee | 0.0 /100 | #332 | Tragic 7.8% |
| Cherokee | 0.0 /100 | #333 | Tragic 7.9% |
| Yuman | 0.0 /100 | #334 | Tragic 7.9% |
| Chickasaw | 0.0 /100 | #335 | Tragic 8.0% |