Turkish vs Hopi Single Mother Households
COMPARE
Turkish
Hopi
Single Mother Households
Single Mother Households Comparison
Turks
Hopi
5.5%
SINGLE MOTHER HOUSEHOLDS
99.2/ 100
METRIC RATING
48th/ 347
METRIC RANK
8.5%
SINGLE MOTHER HOUSEHOLDS
0.0/ 100
METRIC RATING
329th/ 347
METRIC RANK
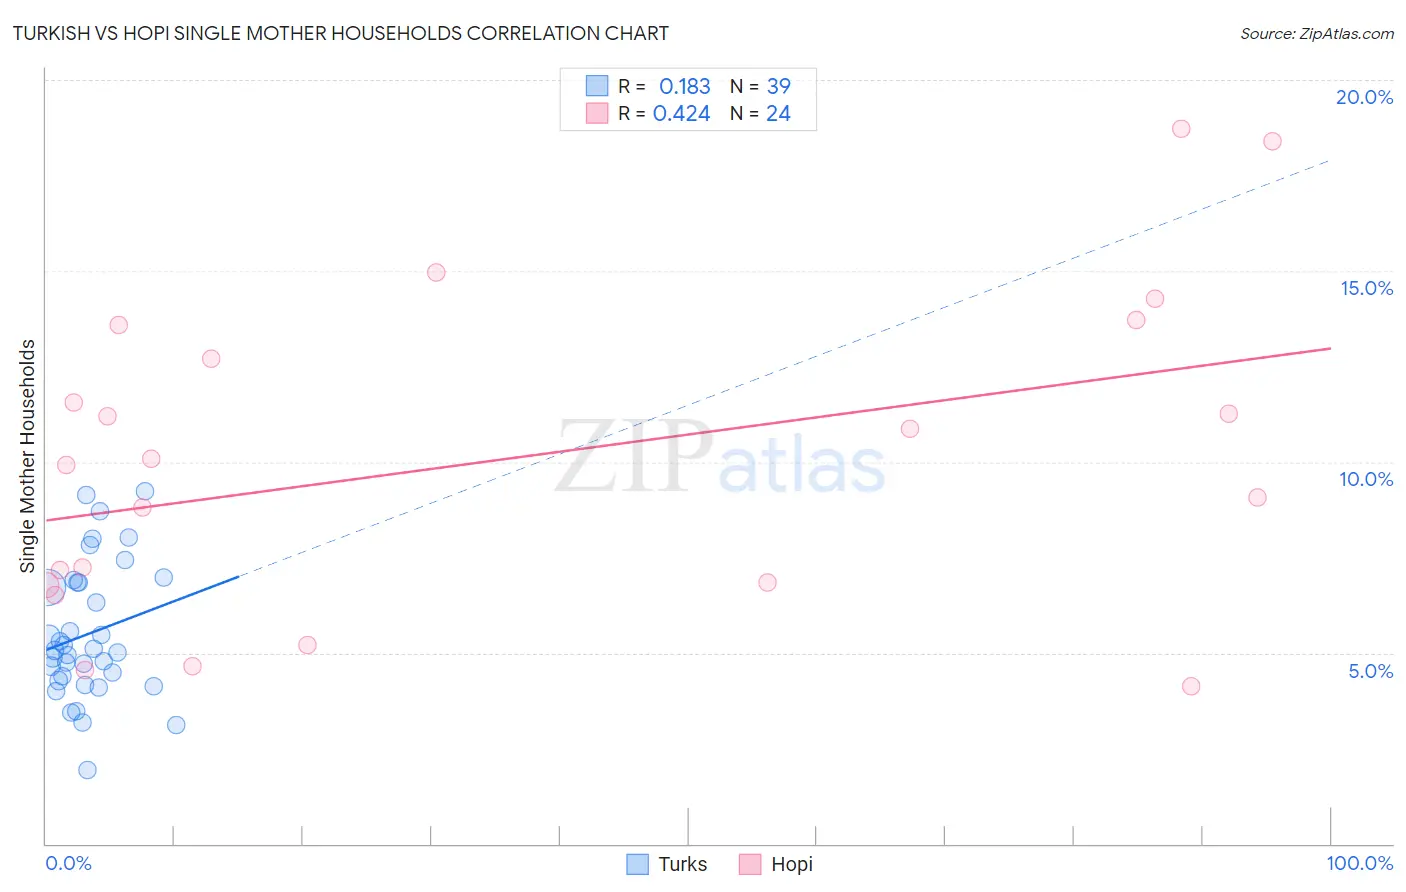
Turkish vs Hopi Single Mother Households Correlation Chart
The statistical analysis conducted on geographies consisting of 271,337,640 people shows a poor positive correlation between the proportion of Turks and percentage of single mother households in the United States with a correlation coefficient (R) of 0.183 and weighted average of 5.5%. Similarly, the statistical analysis conducted on geographies consisting of 74,699,653 people shows a moderate positive correlation between the proportion of Hopi and percentage of single mother households in the United States with a correlation coefficient (R) of 0.424 and weighted average of 8.5%, a difference of 54.7%.
Single Mother Households Correlation Summary
| Measurement | Turkish | Hopi |
| Minimum | 1.9% | 4.1% |
| Maximum | 9.2% | 18.7% |
| Range | 7.3% | 14.6% |
| Mean | 5.5% | 10.1% |
| Median | 5.1% | 10.0% |
| Interquartile 25% (IQ1) | 4.3% | 6.8% |
| Interquartile 75% (IQ3) | 6.9% | 13.1% |
| Interquartile Range (IQR) | 2.6% | 6.4% |
| Standard Deviation (Sample) | 1.8% | 4.2% |
| Standard Deviation (Population) | 1.7% | 4.1% |
Similar Demographics by Single Mother Households
Demographics Similar to Turks by Single Mother Households
In terms of single mother households, the demographic groups most similar to Turks are Immigrants from Latvia (5.5%, a difference of 0.030%), Norwegian (5.5%, a difference of 0.20%), Immigrants from Scotland (5.5%, a difference of 0.22%), Immigrants from Belarus (5.5%, a difference of 0.24%), and Swedish (5.5%, a difference of 0.30%).
| Demographics | Rating | Rank | Single Mother Households |
| Immigrants | Greece | 99.5 /100 | #41 | Exceptional 5.4% |
| Macedonians | 99.5 /100 | #42 | Exceptional 5.4% |
| Immigrants | South Central Asia | 99.5 /100 | #43 | Exceptional 5.4% |
| Lithuanians | 99.4 /100 | #44 | Exceptional 5.4% |
| Immigrants | Croatia | 99.4 /100 | #45 | Exceptional 5.4% |
| Croatians | 99.3 /100 | #46 | Exceptional 5.5% |
| Norwegians | 99.3 /100 | #47 | Exceptional 5.5% |
| Turks | 99.2 /100 | #48 | Exceptional 5.5% |
| Immigrants | Latvia | 99.2 /100 | #49 | Exceptional 5.5% |
| Immigrants | Scotland | 99.2 /100 | #50 | Exceptional 5.5% |
| Immigrants | Belarus | 99.2 /100 | #51 | Exceptional 5.5% |
| Swedes | 99.1 /100 | #52 | Exceptional 5.5% |
| Immigrants | Russia | 99.1 /100 | #53 | Exceptional 5.5% |
| Immigrants | Lebanon | 99.1 /100 | #54 | Exceptional 5.5% |
| Immigrants | Denmark | 99.1 /100 | #55 | Exceptional 5.5% |
Demographics Similar to Hopi by Single Mother Households
In terms of single mother households, the demographic groups most similar to Hopi are Inupiat (8.5%, a difference of 0.11%), Sioux (8.5%, a difference of 0.11%), Yakama (8.4%, a difference of 0.75%), Immigrants from Haiti (8.4%, a difference of 0.92%), and British West Indian (8.4%, a difference of 1.1%).
| Demographics | Rating | Rank | Single Mother Households |
| Pima | 0.0 /100 | #322 | Tragic 8.3% |
| Haitians | 0.0 /100 | #323 | Tragic 8.3% |
| Immigrants | Jamaica | 0.0 /100 | #324 | Tragic 8.4% |
| Immigrants | Caribbean | 0.0 /100 | #325 | Tragic 8.4% |
| British West Indians | 0.0 /100 | #326 | Tragic 8.4% |
| Immigrants | Haiti | 0.0 /100 | #327 | Tragic 8.4% |
| Yakama | 0.0 /100 | #328 | Tragic 8.4% |
| Hopi | 0.0 /100 | #329 | Tragic 8.5% |
| Inupiat | 0.0 /100 | #330 | Tragic 8.5% |
| Sioux | 0.0 /100 | #331 | Tragic 8.5% |
| U.S. Virgin Islanders | 0.0 /100 | #332 | Tragic 8.6% |
| Liberians | 0.0 /100 | #333 | Tragic 8.6% |
| Immigrants | Liberia | 0.0 /100 | #334 | Tragic 8.7% |
| Immigrants | Dominica | 0.0 /100 | #335 | Tragic 8.7% |
| Puerto Ricans | 0.0 /100 | #336 | Tragic 8.7% |