Korean vs Hopi Ambulatory Disability
COMPARE
Korean
Hopi
Ambulatory Disability
Ambulatory Disability Comparison
Koreans
Hopi
5.9%
AMBULATORY DISABILITY
91.6/ 100
METRIC RATING
125th/ 347
METRIC RANK
7.6%
AMBULATORY DISABILITY
0.0/ 100
METRIC RATING
328th/ 347
METRIC RANK
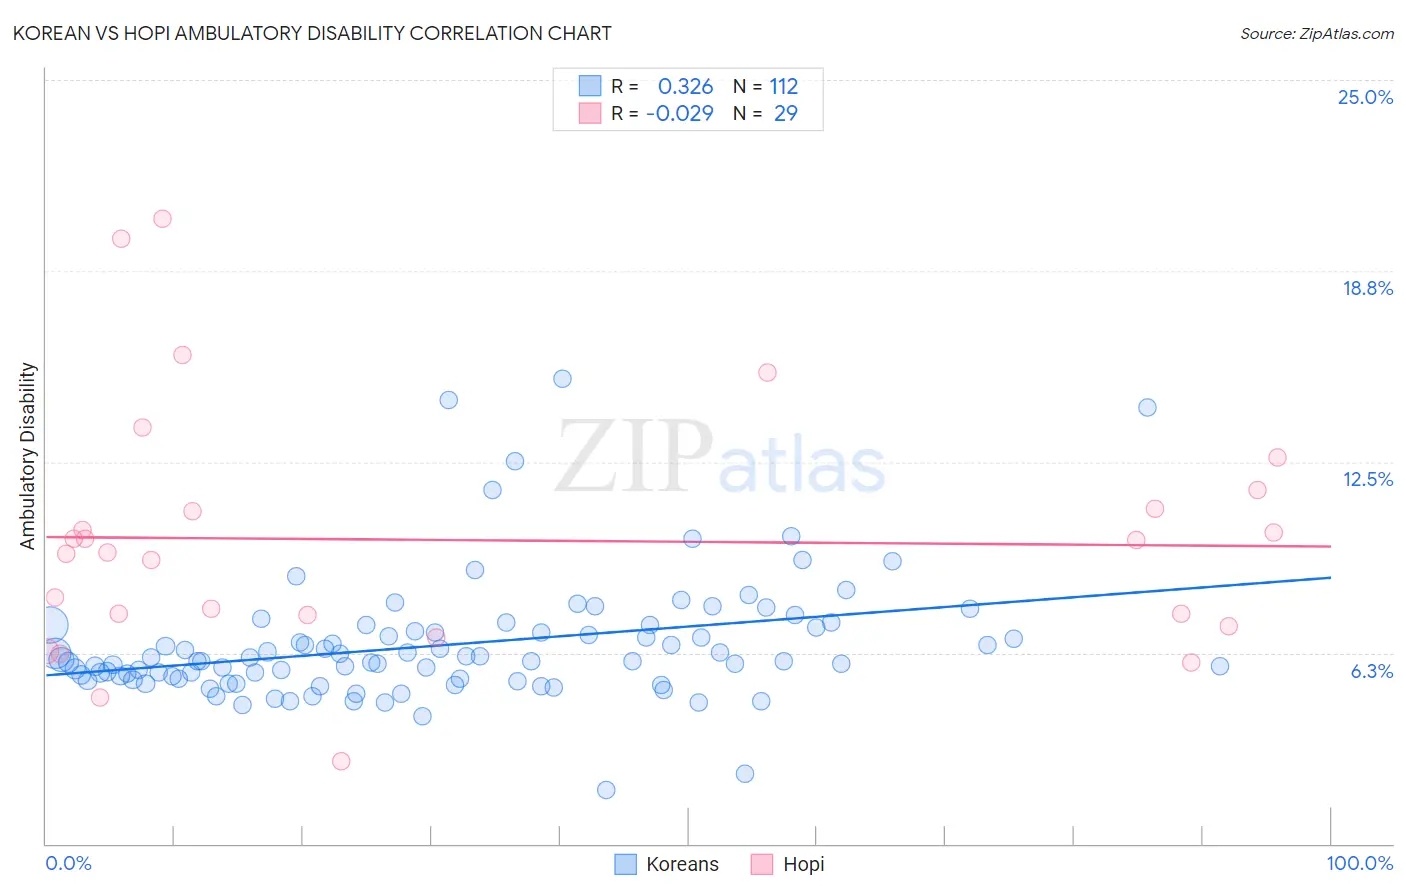
Korean vs Hopi Ambulatory Disability Correlation Chart
The statistical analysis conducted on geographies consisting of 510,581,293 people shows a mild positive correlation between the proportion of Koreans and percentage of population with ambulatory disability in the United States with a correlation coefficient (R) of 0.326 and weighted average of 5.9%. Similarly, the statistical analysis conducted on geographies consisting of 74,727,187 people shows no correlation between the proportion of Hopi and percentage of population with ambulatory disability in the United States with a correlation coefficient (R) of -0.029 and weighted average of 7.6%, a difference of 28.2%.
Ambulatory Disability Correlation Summary
| Measurement | Korean | Hopi |
| Minimum | 1.8% | 2.7% |
| Maximum | 15.2% | 20.4% |
| Range | 13.4% | 17.7% |
| Mean | 6.5% | 9.9% |
| Median | 6.0% | 9.5% |
| Interquartile 25% (IQ1) | 5.4% | 7.3% |
| Interquartile 75% (IQ3) | 7.0% | 11.3% |
| Interquartile Range (IQR) | 1.6% | 4.0% |
| Standard Deviation (Sample) | 2.0% | 4.1% |
| Standard Deviation (Population) | 2.0% | 4.0% |
Similar Demographics by Ambulatory Disability
Demographics Similar to Koreans by Ambulatory Disability
In terms of ambulatory disability, the demographic groups most similar to Koreans are Arab (5.9%, a difference of 0.020%), Immigrants from Nigeria (5.9%, a difference of 0.11%), Immigrants from Middle Africa (5.9%, a difference of 0.12%), Immigrants from Western Asia (5.9%, a difference of 0.15%), and Immigrants from Russia (5.9%, a difference of 0.16%).
| Demographics | Rating | Rank | Ambulatory Disability |
| Russians | 93.4 /100 | #118 | Exceptional 5.9% |
| Norwegians | 93.1 /100 | #119 | Exceptional 5.9% |
| Estonians | 92.9 /100 | #120 | Exceptional 5.9% |
| Costa Ricans | 92.6 /100 | #121 | Exceptional 5.9% |
| Icelanders | 92.6 /100 | #122 | Exceptional 5.9% |
| Immigrants | Russia | 92.4 /100 | #123 | Exceptional 5.9% |
| Immigrants | Middle Africa | 92.2 /100 | #124 | Exceptional 5.9% |
| Koreans | 91.6 /100 | #125 | Exceptional 5.9% |
| Arabs | 91.5 /100 | #126 | Exceptional 5.9% |
| Immigrants | Nigeria | 90.9 /100 | #127 | Exceptional 5.9% |
| Immigrants | Western Asia | 90.7 /100 | #128 | Exceptional 5.9% |
| Immigrants | Norway | 90.5 /100 | #129 | Exceptional 5.9% |
| Immigrants | Kazakhstan | 89.7 /100 | #130 | Excellent 5.9% |
| Immigrants | Costa Rica | 89.5 /100 | #131 | Excellent 5.9% |
| Immigrants | Europe | 87.8 /100 | #132 | Excellent 6.0% |
Demographics Similar to Hopi by Ambulatory Disability
In terms of ambulatory disability, the demographic groups most similar to Hopi are Pueblo (7.6%, a difference of 0.040%), Native/Alaskan (7.5%, a difference of 0.94%), Black/African American (7.5%, a difference of 0.95%), Comanche (7.5%, a difference of 1.1%), and Navajo (7.5%, a difference of 1.1%).
| Demographics | Rating | Rank | Ambulatory Disability |
| Apache | 0.0 /100 | #321 | Tragic 7.4% |
| Osage | 0.0 /100 | #322 | Tragic 7.4% |
| Americans | 0.0 /100 | #323 | Tragic 7.4% |
| Navajo | 0.0 /100 | #324 | Tragic 7.5% |
| Comanche | 0.0 /100 | #325 | Tragic 7.5% |
| Blacks/African Americans | 0.0 /100 | #326 | Tragic 7.5% |
| Natives/Alaskans | 0.0 /100 | #327 | Tragic 7.5% |
| Hopi | 0.0 /100 | #328 | Tragic 7.6% |
| Pueblo | 0.0 /100 | #329 | Tragic 7.6% |
| Paiute | 0.0 /100 | #330 | Tragic 7.7% |
| Cajuns | 0.0 /100 | #331 | Tragic 7.8% |
| Menominee | 0.0 /100 | #332 | Tragic 7.8% |
| Cherokee | 0.0 /100 | #333 | Tragic 7.9% |
| Yuman | 0.0 /100 | #334 | Tragic 7.9% |
| Chickasaw | 0.0 /100 | #335 | Tragic 8.0% |