Bangladeshi vs Immigrants from Caribbean Female Disability
COMPARE
Bangladeshi
Immigrants from Caribbean
Female Disability
Female Disability Comparison
Bangladeshis
Immigrants from Caribbean
13.1%
FEMALE DISABILITY
0.0/ 100
METRIC RATING
285th/ 347
METRIC RANK
12.7%
FEMALE DISABILITY
1.4/ 100
METRIC RATING
252nd/ 347
METRIC RANK
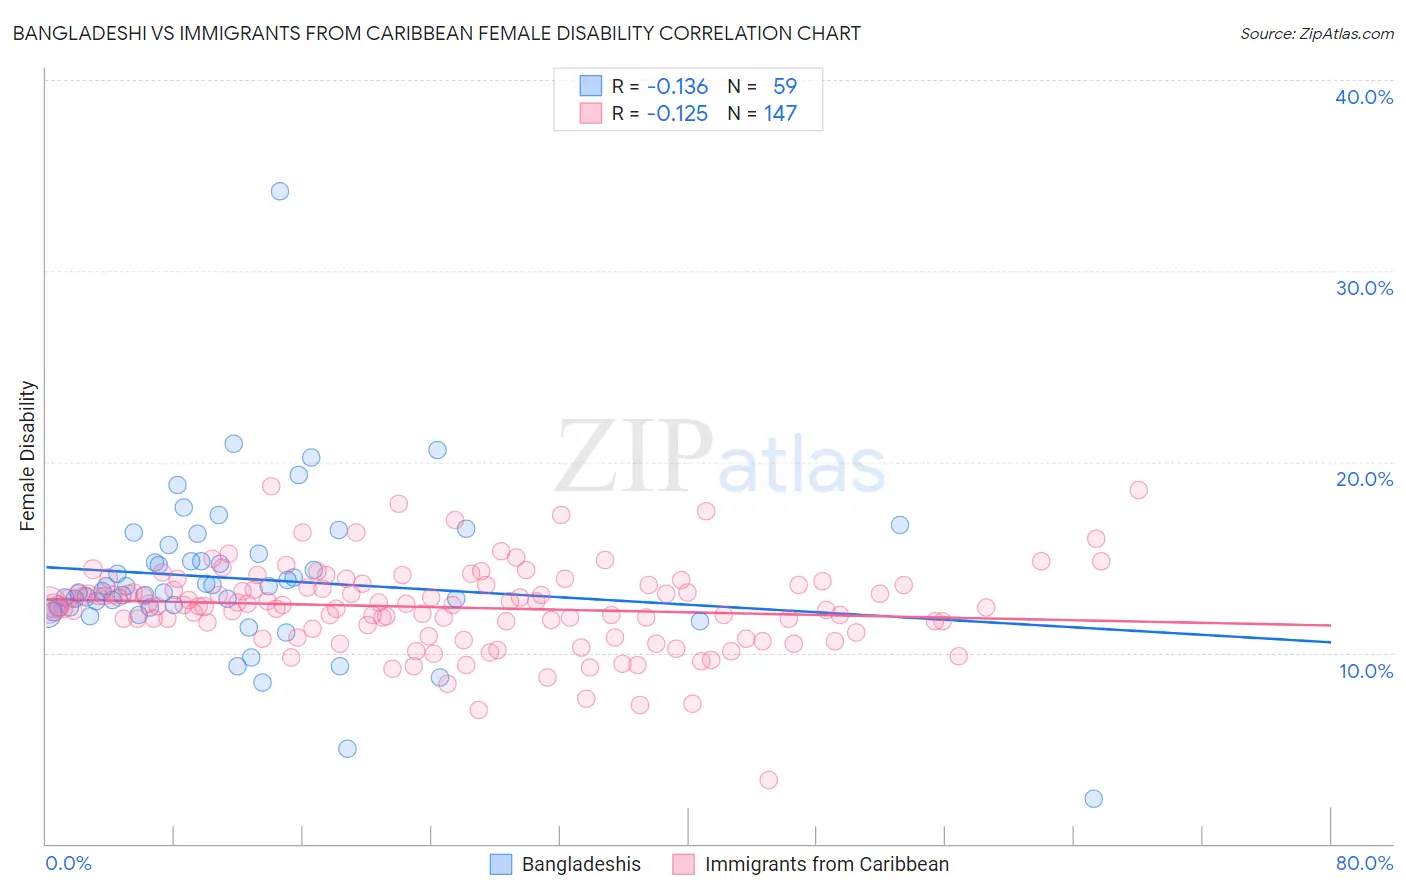
Bangladeshi vs Immigrants from Caribbean Female Disability Correlation Chart
The statistical analysis conducted on geographies consisting of 141,386,461 people shows a poor negative correlation between the proportion of Bangladeshis and percentage of females with a disability in the United States with a correlation coefficient (R) of -0.136 and weighted average of 13.1%. Similarly, the statistical analysis conducted on geographies consisting of 449,918,897 people shows a poor negative correlation between the proportion of Immigrants from Caribbean and percentage of females with a disability in the United States with a correlation coefficient (R) of -0.125 and weighted average of 12.7%, a difference of 3.3%.
Female Disability Correlation Summary
| Measurement | Bangladeshi | Immigrants from Caribbean |
| Minimum | 2.3% | 3.3% |
| Maximum | 34.2% | 18.7% |
| Range | 31.9% | 15.4% |
| Mean | 13.9% | 12.4% |
| Median | 13.3% | 12.5% |
| Interquartile 25% (IQ1) | 12.4% | 11.3% |
| Interquartile 75% (IQ3) | 15.2% | 13.5% |
| Interquartile Range (IQR) | 2.8% | 2.3% |
| Standard Deviation (Sample) | 4.2% | 2.2% |
| Standard Deviation (Population) | 4.2% | 2.2% |
Similar Demographics by Female Disability
Demographics Similar to Bangladeshis by Female Disability
In terms of female disability, the demographic groups most similar to Bangladeshis are Hmong (13.1%, a difference of 0.050%), Fijian (13.1%, a difference of 0.050%), English (13.1%, a difference of 0.18%), Welsh (13.1%, a difference of 0.19%), and U.S. Virgin Islander (13.1%, a difference of 0.27%).
| Demographics | Rating | Rank | Female Disability |
| Scottish | 0.1 /100 | #278 | Tragic 13.0% |
| Arapaho | 0.1 /100 | #279 | Tragic 13.0% |
| Irish | 0.1 /100 | #280 | Tragic 13.1% |
| U.S. Virgin Islanders | 0.1 /100 | #281 | Tragic 13.1% |
| Welsh | 0.0 /100 | #282 | Tragic 13.1% |
| English | 0.0 /100 | #283 | Tragic 13.1% |
| Hmong | 0.0 /100 | #284 | Tragic 13.1% |
| Bangladeshis | 0.0 /100 | #285 | Tragic 13.1% |
| Fijians | 0.0 /100 | #286 | Tragic 13.1% |
| Yaqui | 0.0 /100 | #287 | Tragic 13.2% |
| Whites/Caucasians | 0.0 /100 | #288 | Tragic 13.2% |
| Tlingit-Haida | 0.0 /100 | #289 | Tragic 13.2% |
| Immigrants | Yemen | 0.0 /100 | #290 | Tragic 13.2% |
| Shoshone | 0.0 /100 | #291 | Tragic 13.2% |
| Yakama | 0.0 /100 | #292 | Tragic 13.2% |
Demographics Similar to Immigrants from Caribbean by Female Disability
In terms of female disability, the demographic groups most similar to Immigrants from Caribbean are Jamaican (12.7%, a difference of 0.010%), Hawaiian (12.7%, a difference of 0.040%), Crow (12.7%, a difference of 0.080%), Immigrants from Germany (12.7%, a difference of 0.12%), and Slovene (12.7%, a difference of 0.14%).
| Demographics | Rating | Rank | Female Disability |
| Immigrants | Jamaica | 2.2 /100 | #245 | Tragic 12.6% |
| Spanish American Indians | 2.1 /100 | #246 | Tragic 12.6% |
| Menominee | 2.1 /100 | #247 | Tragic 12.6% |
| Carpatho Rusyns | 2.0 /100 | #248 | Tragic 12.6% |
| Immigrants | Congo | 1.8 /100 | #249 | Tragic 12.7% |
| Slovenes | 1.7 /100 | #250 | Tragic 12.7% |
| Crow | 1.6 /100 | #251 | Tragic 12.7% |
| Immigrants | Caribbean | 1.4 /100 | #252 | Tragic 12.7% |
| Jamaicans | 1.4 /100 | #253 | Tragic 12.7% |
| Hawaiians | 1.4 /100 | #254 | Tragic 12.7% |
| Immigrants | Germany | 1.3 /100 | #255 | Tragic 12.7% |
| British West Indians | 1.2 /100 | #256 | Tragic 12.7% |
| Liberians | 1.1 /100 | #257 | Tragic 12.7% |
| Aleuts | 1.1 /100 | #258 | Tragic 12.7% |
| Immigrants | Armenia | 1.0 /100 | #259 | Tragic 12.7% |