Trinidadian and Tobagonian vs Marshallese Ambulatory Disability
COMPARE
Trinidadian and Tobagonian
Marshallese
Ambulatory Disability
Ambulatory Disability Comparison
Trinidadians and Tobagonians
Marshallese
6.6%
AMBULATORY DISABILITY
0.2/ 100
METRIC RATING
267th/ 347
METRIC RANK
6.9%
AMBULATORY DISABILITY
0.0/ 100
METRIC RATING
300th/ 347
METRIC RANK
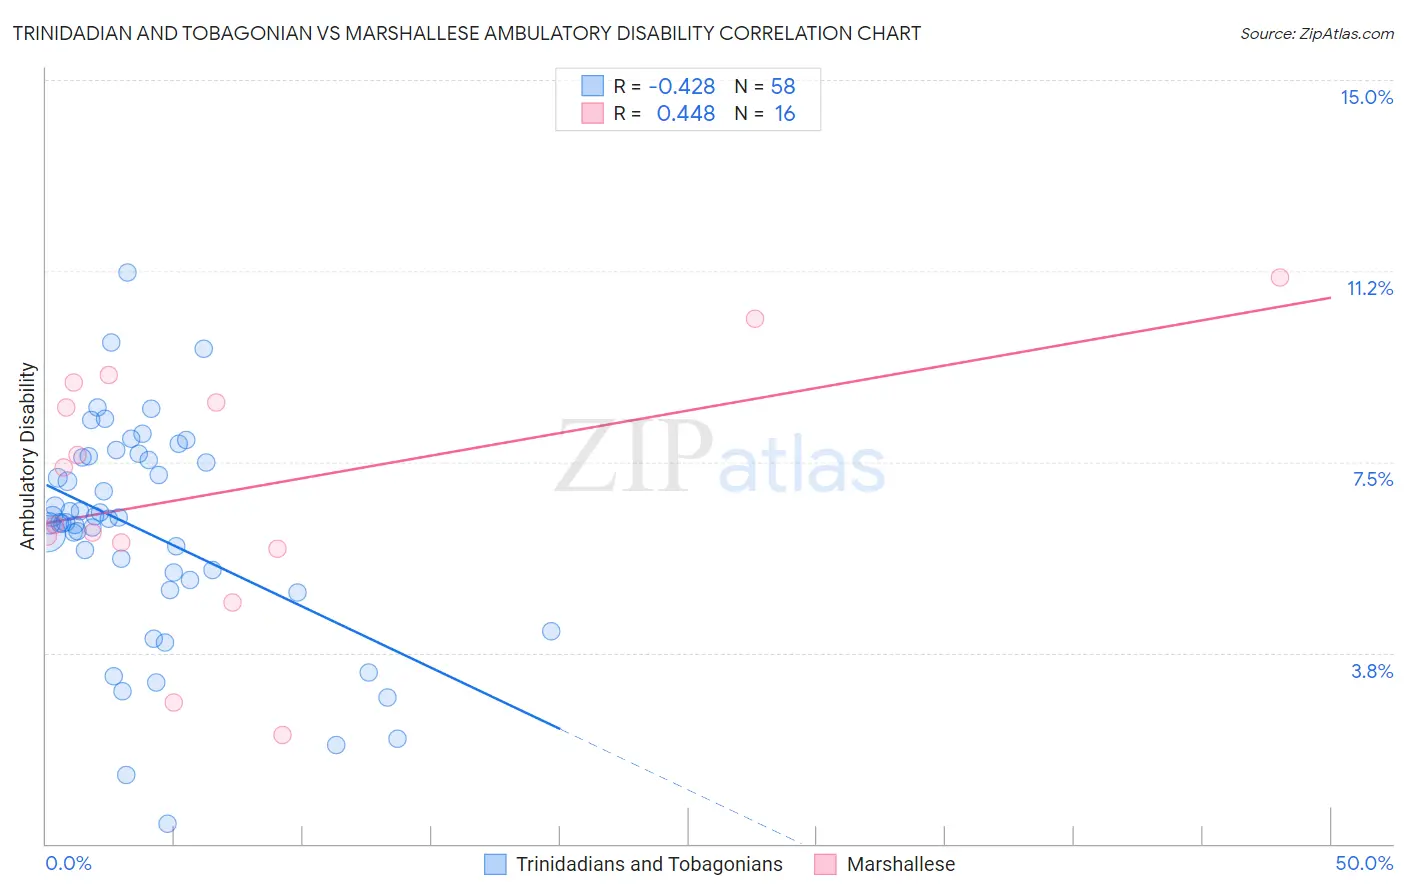
Trinidadian and Tobagonian vs Marshallese Ambulatory Disability Correlation Chart
The statistical analysis conducted on geographies consisting of 219,787,552 people shows a moderate negative correlation between the proportion of Trinidadians and Tobagonians and percentage of population with ambulatory disability in the United States with a correlation coefficient (R) of -0.428 and weighted average of 6.6%. Similarly, the statistical analysis conducted on geographies consisting of 14,761,315 people shows a moderate positive correlation between the proportion of Marshallese and percentage of population with ambulatory disability in the United States with a correlation coefficient (R) of 0.448 and weighted average of 6.9%, a difference of 4.8%.
Ambulatory Disability Correlation Summary
| Measurement | Trinidadian and Tobagonian | Marshallese |
| Minimum | 0.38% | 2.1% |
| Maximum | 11.2% | 11.1% |
| Range | 10.8% | 9.0% |
| Mean | 6.1% | 7.0% |
| Median | 6.3% | 6.8% |
| Interquartile 25% (IQ1) | 5.2% | 5.8% |
| Interquartile 75% (IQ3) | 7.6% | 8.9% |
| Interquartile Range (IQR) | 2.4% | 3.0% |
| Standard Deviation (Sample) | 2.1% | 2.5% |
| Standard Deviation (Population) | 2.1% | 2.4% |
Similar Demographics by Ambulatory Disability
Demographics Similar to Trinidadians and Tobagonians by Ambulatory Disability
In terms of ambulatory disability, the demographic groups most similar to Trinidadians and Tobagonians are Spanish (6.6%, a difference of 0.020%), Guyanese (6.6%, a difference of 0.13%), Bahamian (6.6%, a difference of 0.25%), Nepalese (6.6%, a difference of 0.31%), and French (6.6%, a difference of 0.32%).
| Demographics | Rating | Rank | Ambulatory Disability |
| Immigrants | Belize | 0.4 /100 | #260 | Tragic 6.6% |
| Irish | 0.4 /100 | #261 | Tragic 6.6% |
| English | 0.4 /100 | #262 | Tragic 6.6% |
| Hmong | 0.3 /100 | #263 | Tragic 6.6% |
| Nepalese | 0.2 /100 | #264 | Tragic 6.6% |
| Bahamians | 0.2 /100 | #265 | Tragic 6.6% |
| Guyanese | 0.2 /100 | #266 | Tragic 6.6% |
| Trinidadians and Tobagonians | 0.2 /100 | #267 | Tragic 6.6% |
| Spanish | 0.2 /100 | #268 | Tragic 6.6% |
| French | 0.1 /100 | #269 | Tragic 6.6% |
| Slovaks | 0.1 /100 | #270 | Tragic 6.7% |
| Immigrants | Trinidad and Tobago | 0.1 /100 | #271 | Tragic 6.7% |
| French Canadians | 0.1 /100 | #272 | Tragic 6.7% |
| Whites/Caucasians | 0.1 /100 | #273 | Tragic 6.7% |
| Sioux | 0.1 /100 | #274 | Tragic 6.7% |
Demographics Similar to Marshallese by Ambulatory Disability
In terms of ambulatory disability, the demographic groups most similar to Marshallese are Puget Sound Salish (6.9%, a difference of 0.010%), Immigrants from Grenada (6.9%, a difference of 0.14%), French American Indian (6.9%, a difference of 0.15%), British West Indian (7.0%, a difference of 0.23%), and Immigrants from Armenia (7.0%, a difference of 0.28%).
| Demographics | Rating | Rank | Ambulatory Disability |
| Immigrants | St. Vincent and the Grenadines | 0.0 /100 | #293 | Tragic 6.9% |
| Cape Verdeans | 0.0 /100 | #294 | Tragic 6.9% |
| Crow | 0.0 /100 | #295 | Tragic 6.9% |
| Alaskan Athabascans | 0.0 /100 | #296 | Tragic 6.9% |
| French American Indians | 0.0 /100 | #297 | Tragic 6.9% |
| Immigrants | Grenada | 0.0 /100 | #298 | Tragic 6.9% |
| Puget Sound Salish | 0.0 /100 | #299 | Tragic 6.9% |
| Marshallese | 0.0 /100 | #300 | Tragic 6.9% |
| British West Indians | 0.0 /100 | #301 | Tragic 7.0% |
| Immigrants | Armenia | 0.0 /100 | #302 | Tragic 7.0% |
| Africans | 0.0 /100 | #303 | Tragic 7.0% |
| Immigrants | Cabo Verde | 0.0 /100 | #304 | Tragic 7.0% |
| Immigrants | Micronesia | 0.0 /100 | #305 | Tragic 7.0% |
| Iroquois | 0.0 /100 | #306 | Tragic 7.1% |
| Spanish Americans | 0.0 /100 | #307 | Tragic 7.1% |