Trinidadian and Tobagonian vs Marshallese 2nd Grade
COMPARE
Trinidadian and Tobagonian
Marshallese
2nd Grade
2nd Grade Comparison
Trinidadians and Tobagonians
Marshallese
97.3%
2ND GRADE
0.1/ 100
METRIC RATING
281st/ 347
METRIC RANK
97.9%
2ND GRADE
67.7/ 100
METRIC RATING
154th/ 347
METRIC RANK
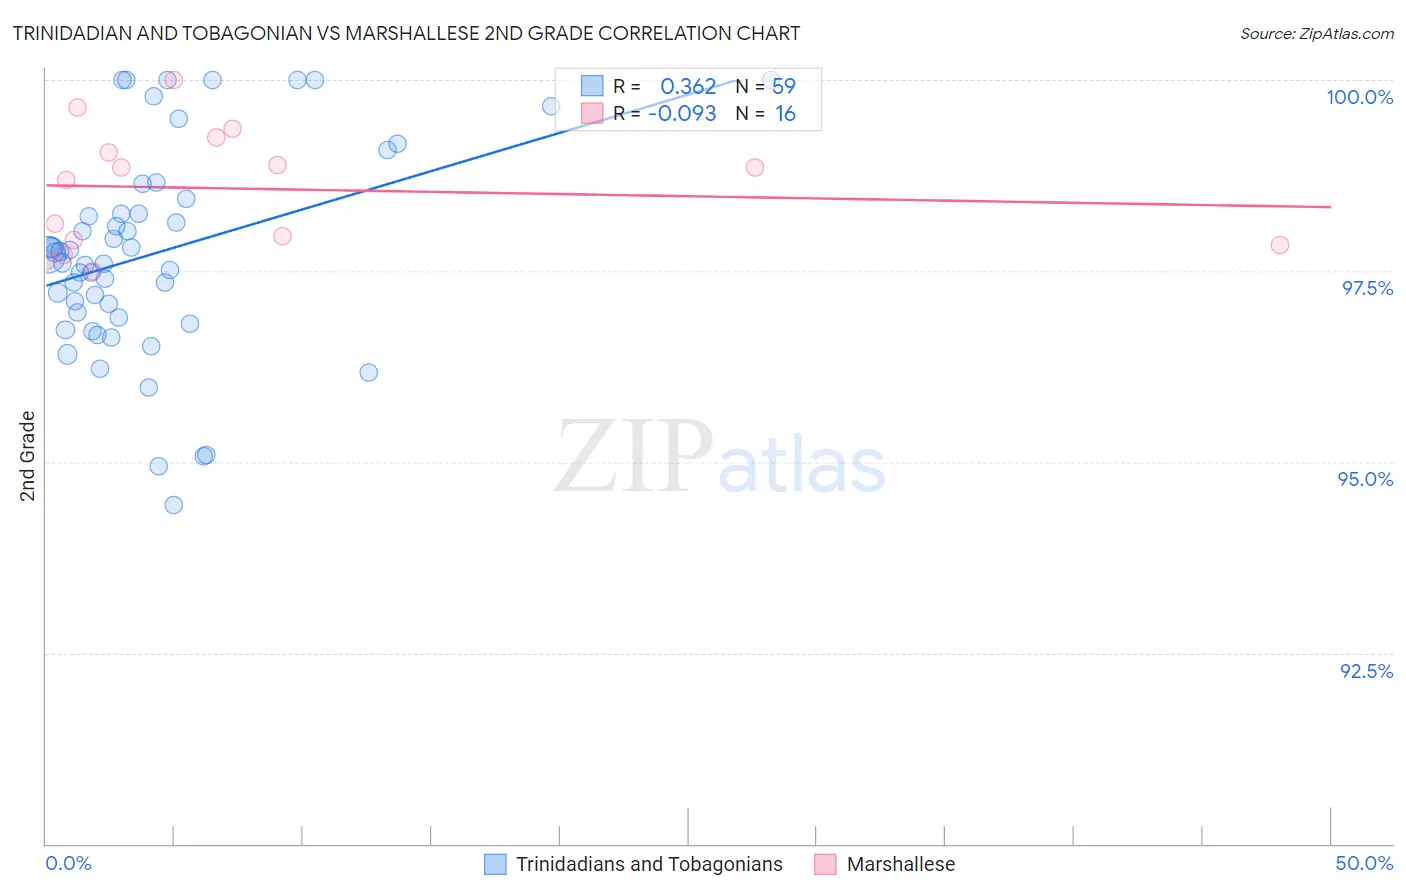
Trinidadian and Tobagonian vs Marshallese 2nd Grade Correlation Chart
The statistical analysis conducted on geographies consisting of 219,882,819 people shows a mild positive correlation between the proportion of Trinidadians and Tobagonians and percentage of population with at least 2nd grade education in the United States with a correlation coefficient (R) of 0.362 and weighted average of 97.3%. Similarly, the statistical analysis conducted on geographies consisting of 14,761,315 people shows a slight negative correlation between the proportion of Marshallese and percentage of population with at least 2nd grade education in the United States with a correlation coefficient (R) of -0.093 and weighted average of 97.9%, a difference of 0.65%.
2nd Grade Correlation Summary
| Measurement | Trinidadian and Tobagonian | Marshallese |
| Minimum | 94.4% | 97.5% |
| Maximum | 100.0% | 100.0% |
| Range | 5.6% | 2.5% |
| Mean | 97.7% | 98.6% |
| Median | 97.7% | 98.8% |
| Interquartile 25% (IQ1) | 96.9% | 97.9% |
| Interquartile 75% (IQ3) | 98.4% | 99.1% |
| Interquartile Range (IQR) | 1.6% | 1.3% |
| Standard Deviation (Sample) | 1.4% | 0.78% |
| Standard Deviation (Population) | 1.3% | 0.75% |
Similar Demographics by 2nd Grade
Demographics Similar to Trinidadians and Tobagonians by 2nd Grade
In terms of 2nd grade, the demographic groups most similar to Trinidadians and Tobagonians are Afghan (97.3%, a difference of 0.0%), Immigrants from Ghana (97.3%, a difference of 0.010%), Barbadian (97.3%, a difference of 0.010%), Immigrants from Uzbekistan (97.3%, a difference of 0.020%), and Immigrants from Philippines (97.3%, a difference of 0.030%).
| Demographics | Rating | Rank | 2nd Grade |
| Ghanaians | 0.1 /100 | #274 | Tragic 97.4% |
| Immigrants | China | 0.1 /100 | #275 | Tragic 97.3% |
| Immigrants | Philippines | 0.1 /100 | #276 | Tragic 97.3% |
| Immigrants | Western Africa | 0.1 /100 | #277 | Tragic 97.3% |
| Immigrants | Uzbekistan | 0.1 /100 | #278 | Tragic 97.3% |
| Immigrants | Ghana | 0.1 /100 | #279 | Tragic 97.3% |
| Afghans | 0.1 /100 | #280 | Tragic 97.3% |
| Trinidadians and Tobagonians | 0.1 /100 | #281 | Tragic 97.3% |
| Barbadians | 0.1 /100 | #282 | Tragic 97.3% |
| Immigrants | Trinidad and Tobago | 0.0 /100 | #283 | Tragic 97.2% |
| Immigrants | West Indies | 0.0 /100 | #284 | Tragic 97.2% |
| Immigrants | Hong Kong | 0.0 /100 | #285 | Tragic 97.2% |
| Immigrants | Barbados | 0.0 /100 | #286 | Tragic 97.2% |
| Immigrants | Portugal | 0.0 /100 | #287 | Tragic 97.2% |
| Immigrants | Thailand | 0.0 /100 | #288 | Tragic 97.2% |
Demographics Similar to Marshallese by 2nd Grade
In terms of 2nd grade, the demographic groups most similar to Marshallese are Immigrants from North Macedonia (97.9%, a difference of 0.0%), Immigrants from South Central Asia (97.9%, a difference of 0.0%), Soviet Union (97.9%, a difference of 0.010%), French American Indian (97.9%, a difference of 0.010%), and Dutch West Indian (97.9%, a difference of 0.010%).
| Demographics | Rating | Rank | 2nd Grade |
| Immigrants | Greece | 76.8 /100 | #147 | Good 98.0% |
| Jordanians | 74.5 /100 | #148 | Good 98.0% |
| Apache | 74.0 /100 | #149 | Good 97.9% |
| Immigrants | Moldova | 72.9 /100 | #150 | Good 97.9% |
| Soviet Union | 70.7 /100 | #151 | Good 97.9% |
| Immigrants | North Macedonia | 68.5 /100 | #152 | Good 97.9% |
| Immigrants | South Central Asia | 68.3 /100 | #153 | Good 97.9% |
| Marshallese | 67.7 /100 | #154 | Good 97.9% |
| French American Indians | 64.3 /100 | #155 | Good 97.9% |
| Dutch West Indians | 63.8 /100 | #156 | Good 97.9% |
| Venezuelans | 63.3 /100 | #157 | Good 97.9% |
| Immigrants | Iran | 62.8 /100 | #158 | Good 97.9% |
| Comanche | 62.8 /100 | #159 | Good 97.9% |
| Immigrants | Eastern Europe | 61.1 /100 | #160 | Good 97.9% |
| Immigrants | Russia | 60.3 /100 | #161 | Good 97.9% |