Trinidadian and Tobagonian vs Dutch West Indian 11th Grade
COMPARE
Trinidadian and Tobagonian
Dutch West Indian
11th Grade
11th Grade Comparison
Trinidadians and Tobagonians
Dutch West Indians
91.1%
11TH GRADE
0.2/ 100
METRIC RATING
270th/ 347
METRIC RANK
90.7%
11TH GRADE
0.0/ 100
METRIC RATING
281st/ 347
METRIC RANK
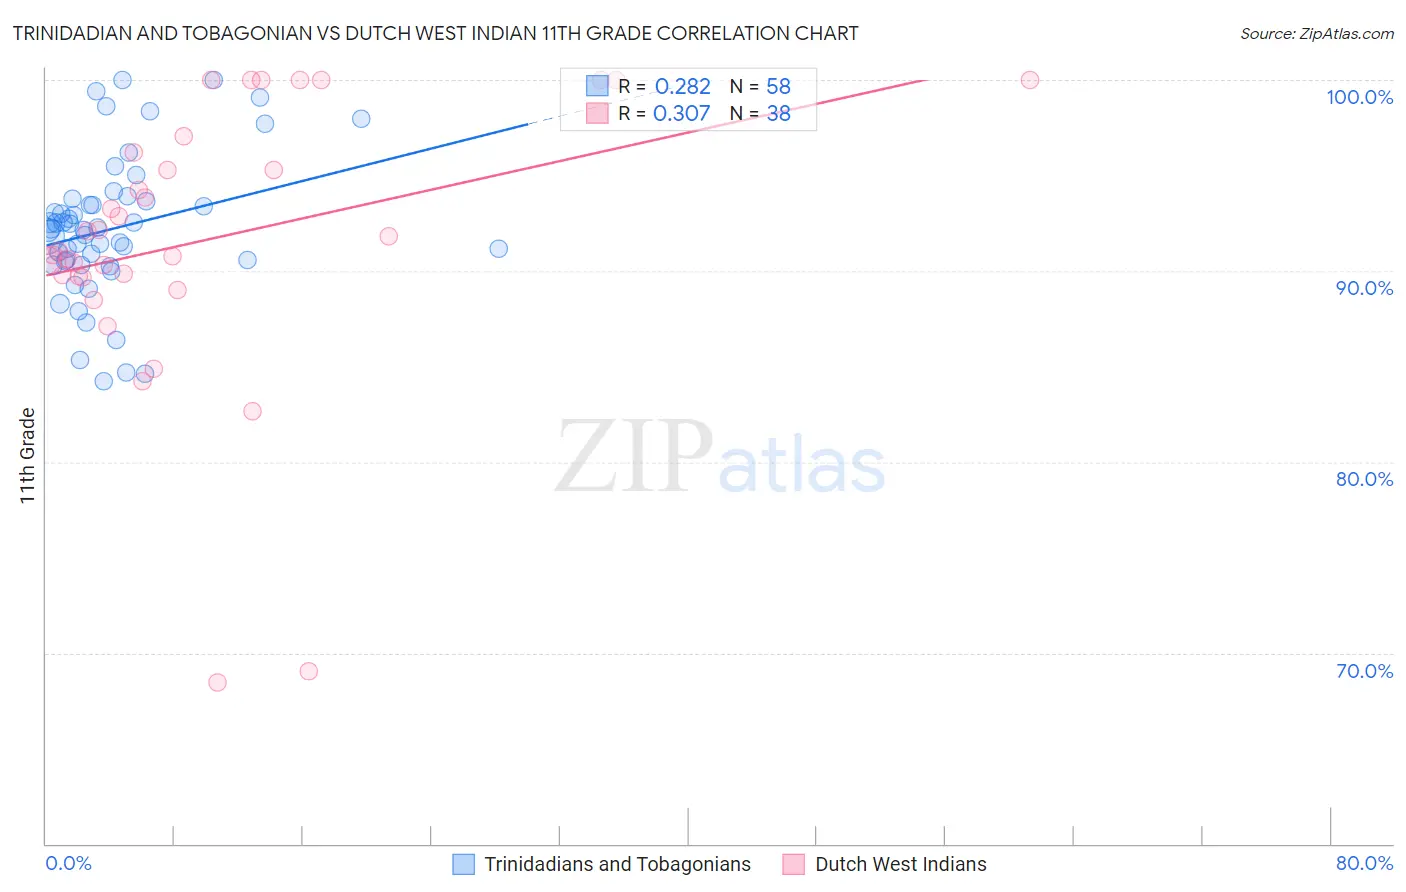
Trinidadian and Tobagonian vs Dutch West Indian 11th Grade Correlation Chart
The statistical analysis conducted on geographies consisting of 219,881,170 people shows a weak positive correlation between the proportion of Trinidadians and Tobagonians and percentage of population with at least 11th grade education in the United States with a correlation coefficient (R) of 0.282 and weighted average of 91.1%. Similarly, the statistical analysis conducted on geographies consisting of 85,776,098 people shows a mild positive correlation between the proportion of Dutch West Indians and percentage of population with at least 11th grade education in the United States with a correlation coefficient (R) of 0.307 and weighted average of 90.7%, a difference of 0.42%.
11th Grade Correlation Summary
| Measurement | Trinidadian and Tobagonian | Dutch West Indian |
| Minimum | 84.2% | 68.4% |
| Maximum | 100.0% | 100.0% |
| Range | 15.8% | 31.6% |
| Mean | 92.2% | 91.6% |
| Median | 92.2% | 91.4% |
| Interquartile 25% (IQ1) | 90.5% | 89.7% |
| Interquartile 75% (IQ3) | 93.7% | 96.2% |
| Interquartile Range (IQR) | 3.2% | 6.5% |
| Standard Deviation (Sample) | 3.7% | 7.2% |
| Standard Deviation (Population) | 3.7% | 7.1% |
Demographics Similar to Trinidadians and Tobagonians and Dutch West Indians by 11th Grade
In terms of 11th grade, the demographic groups most similar to Trinidadians and Tobagonians are Ute (91.1%, a difference of 0.030%), Immigrants from Peru (91.0%, a difference of 0.030%), West Indian (91.0%, a difference of 0.040%), U.S. Virgin Islander (91.1%, a difference of 0.060%), and Paiute (91.0%, a difference of 0.080%). Similarly, the demographic groups most similar to Dutch West Indians are Immigrants from St. Vincent and the Grenadines (90.7%, a difference of 0.010%), Immigrants from Barbados (90.7%, a difference of 0.020%), Sri Lankan (90.7%, a difference of 0.050%), Barbadian (90.8%, a difference of 0.12%), and Malaysian (90.8%, a difference of 0.16%).
| Demographics | Rating | Rank | 11th Grade |
| Pueblo | 0.3 /100 | #265 | Tragic 91.2% |
| Immigrants | Western Africa | 0.3 /100 | #266 | Tragic 91.2% |
| Immigrants | Jamaica | 0.3 /100 | #267 | Tragic 91.2% |
| U.S. Virgin Islanders | 0.2 /100 | #268 | Tragic 91.1% |
| Ute | 0.2 /100 | #269 | Tragic 91.1% |
| Trinidadians and Tobagonians | 0.2 /100 | #270 | Tragic 91.1% |
| Immigrants | Peru | 0.1 /100 | #271 | Tragic 91.0% |
| West Indians | 0.1 /100 | #272 | Tragic 91.0% |
| Paiute | 0.1 /100 | #273 | Tragic 91.0% |
| Immigrants | Trinidad and Tobago | 0.1 /100 | #274 | Tragic 90.9% |
| Immigrants | South Eastern Asia | 0.1 /100 | #275 | Tragic 90.9% |
| Bangladeshis | 0.1 /100 | #276 | Tragic 90.9% |
| Immigrants | Congo | 0.1 /100 | #277 | Tragic 90.9% |
| Malaysians | 0.1 /100 | #278 | Tragic 90.8% |
| Barbadians | 0.0 /100 | #279 | Tragic 90.8% |
| Sri Lankans | 0.0 /100 | #280 | Tragic 90.7% |
| Dutch West Indians | 0.0 /100 | #281 | Tragic 90.7% |
| Immigrants | St. Vincent and the Grenadines | 0.0 /100 | #282 | Tragic 90.7% |
| Immigrants | Barbados | 0.0 /100 | #283 | Tragic 90.7% |
| Immigrants | Laos | 0.0 /100 | #284 | Tragic 90.5% |
| Immigrants | Burma/Myanmar | 0.0 /100 | #285 | Tragic 90.4% |