Immigrants from Northern Africa vs Immigrants from Nepal Male Disability
COMPARE
Immigrants from Northern Africa
Immigrants from Nepal
Male Disability
Male Disability Comparison
Immigrants from Northern Africa
Immigrants from Nepal
10.4%
MALE DISABILITY
99.4/ 100
METRIC RATING
61st/ 347
METRIC RANK
10.3%
MALE DISABILITY
99.8/ 100
METRIC RATING
40th/ 347
METRIC RANK
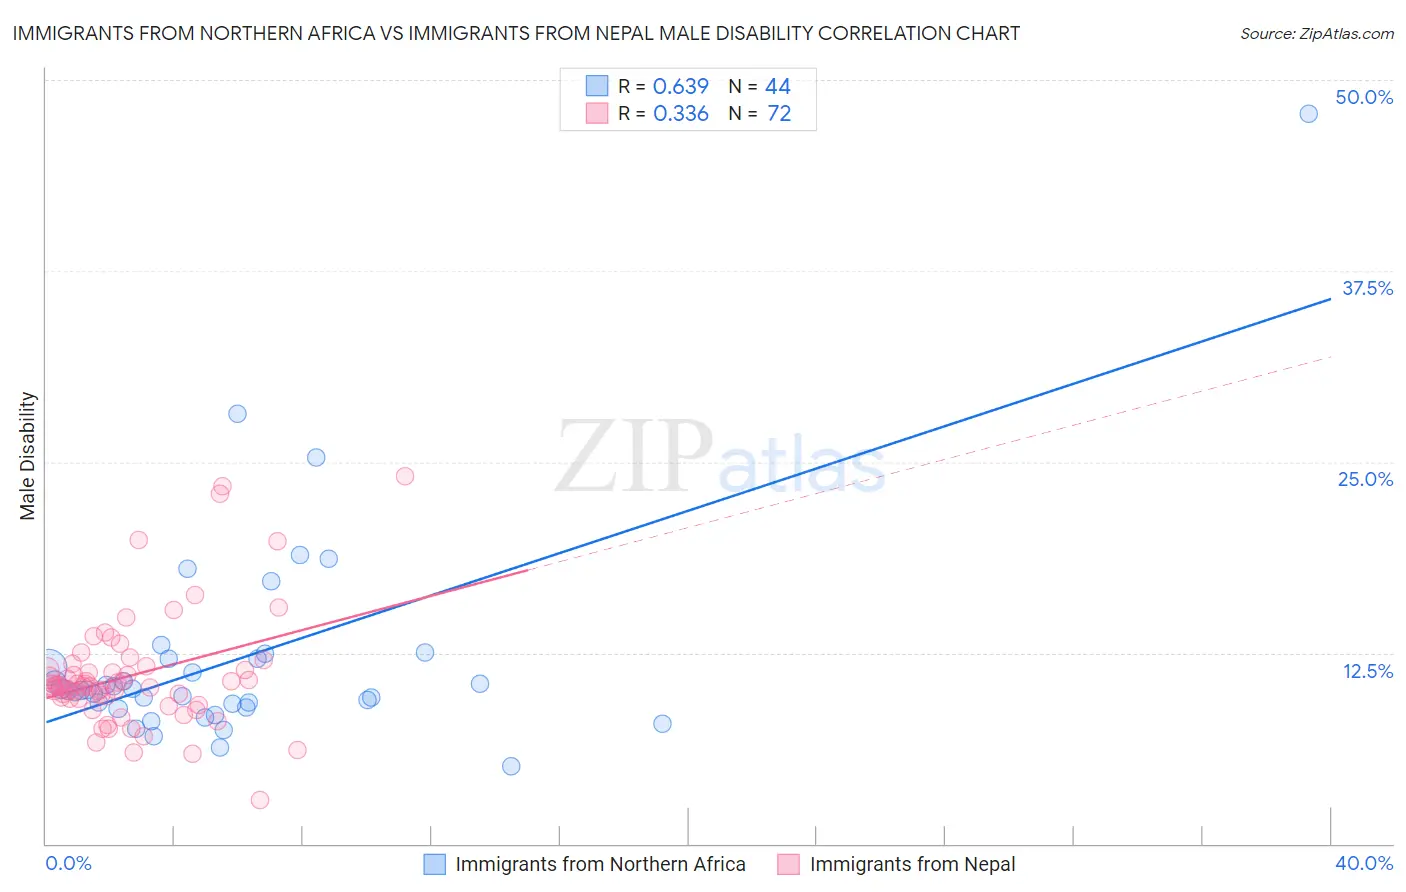
Immigrants from Northern Africa vs Immigrants from Nepal Male Disability Correlation Chart
The statistical analysis conducted on geographies consisting of 321,185,016 people shows a significant positive correlation between the proportion of Immigrants from Northern Africa and percentage of males with a disability in the United States with a correlation coefficient (R) of 0.639 and weighted average of 10.4%. Similarly, the statistical analysis conducted on geographies consisting of 186,783,252 people shows a mild positive correlation between the proportion of Immigrants from Nepal and percentage of males with a disability in the United States with a correlation coefficient (R) of 0.336 and weighted average of 10.3%, a difference of 1.4%.
Male Disability Correlation Summary
| Measurement | Immigrants from Northern Africa | Immigrants from Nepal |
| Minimum | 5.1% | 2.9% |
| Maximum | 47.8% | 24.1% |
| Range | 42.7% | 21.2% |
| Mean | 12.1% | 11.0% |
| Median | 10.0% | 10.4% |
| Interquartile 25% (IQ1) | 9.0% | 9.5% |
| Interquartile 75% (IQ3) | 12.1% | 11.5% |
| Interquartile Range (IQR) | 3.1% | 2.0% |
| Standard Deviation (Sample) | 7.1% | 3.8% |
| Standard Deviation (Population) | 7.1% | 3.8% |
Similar Demographics by Male Disability
Demographics Similar to Immigrants from Northern Africa by Male Disability
In terms of male disability, the demographic groups most similar to Immigrants from Northern Africa are Immigrants from Colombia (10.4%, a difference of 0.090%), Immigrants from Australia (10.4%, a difference of 0.15%), Immigrants from Ecuador (10.4%, a difference of 0.26%), Immigrants from Belarus (10.4%, a difference of 0.29%), and Immigrants from Japan (10.4%, a difference of 0.30%).
| Demographics | Rating | Rank | Male Disability |
| Peruvians | 99.6 /100 | #54 | Exceptional 10.4% |
| Immigrants | Eritrea | 99.6 /100 | #55 | Exceptional 10.4% |
| Tongans | 99.6 /100 | #56 | Exceptional 10.4% |
| Immigrants | South America | 99.6 /100 | #57 | Exceptional 10.4% |
| Immigrants | Japan | 99.5 /100 | #58 | Exceptional 10.4% |
| Immigrants | Australia | 99.5 /100 | #59 | Exceptional 10.4% |
| Immigrants | Colombia | 99.5 /100 | #60 | Exceptional 10.4% |
| Immigrants | Northern Africa | 99.4 /100 | #61 | Exceptional 10.4% |
| Immigrants | Ecuador | 99.3 /100 | #62 | Exceptional 10.4% |
| Immigrants | Belarus | 99.3 /100 | #63 | Exceptional 10.4% |
| Jordanians | 99.3 /100 | #64 | Exceptional 10.5% |
| Immigrants | Grenada | 99.2 /100 | #65 | Exceptional 10.5% |
| Guyanese | 99.2 /100 | #66 | Exceptional 10.5% |
| Immigrants | Afghanistan | 99.2 /100 | #67 | Exceptional 10.5% |
| Colombians | 99.2 /100 | #68 | Exceptional 10.5% |
Demographics Similar to Immigrants from Nepal by Male Disability
In terms of male disability, the demographic groups most similar to Immigrants from Nepal are Taiwanese (10.3%, a difference of 0.0%), Afghan (10.2%, a difference of 0.19%), Mongolian (10.3%, a difference of 0.25%), Immigrants from Bangladesh (10.3%, a difference of 0.27%), and Immigrants from Kuwait (10.2%, a difference of 0.35%).
| Demographics | Rating | Rank | Male Disability |
| Immigrants | Ethiopia | 99.9 /100 | #33 | Exceptional 10.2% |
| Immigrants | Turkey | 99.9 /100 | #34 | Exceptional 10.2% |
| Immigrants | Argentina | 99.9 /100 | #35 | Exceptional 10.2% |
| Ethiopians | 99.8 /100 | #36 | Exceptional 10.2% |
| Immigrants | Indonesia | 99.8 /100 | #37 | Exceptional 10.2% |
| Immigrants | Kuwait | 99.8 /100 | #38 | Exceptional 10.2% |
| Afghans | 99.8 /100 | #39 | Exceptional 10.2% |
| Immigrants | Nepal | 99.8 /100 | #40 | Exceptional 10.3% |
| Taiwanese | 99.8 /100 | #41 | Exceptional 10.3% |
| Mongolians | 99.7 /100 | #42 | Exceptional 10.3% |
| Immigrants | Bangladesh | 99.7 /100 | #43 | Exceptional 10.3% |
| Immigrants | El Salvador | 99.7 /100 | #44 | Exceptional 10.3% |
| Turks | 99.7 /100 | #45 | Exceptional 10.3% |
| Cambodians | 99.7 /100 | #46 | Exceptional 10.3% |
| Immigrants | Peru | 99.7 /100 | #47 | Exceptional 10.3% |