Immigrants from Jamaica vs Immigrants from Nepal Male Disability
COMPARE
Immigrants from Jamaica
Immigrants from Nepal
Male Disability
Male Disability Comparison
Immigrants from Jamaica
Immigrants from Nepal
11.5%
MALE DISABILITY
16.3/ 100
METRIC RATING
198th/ 347
METRIC RANK
10.3%
MALE DISABILITY
99.8/ 100
METRIC RATING
40th/ 347
METRIC RANK
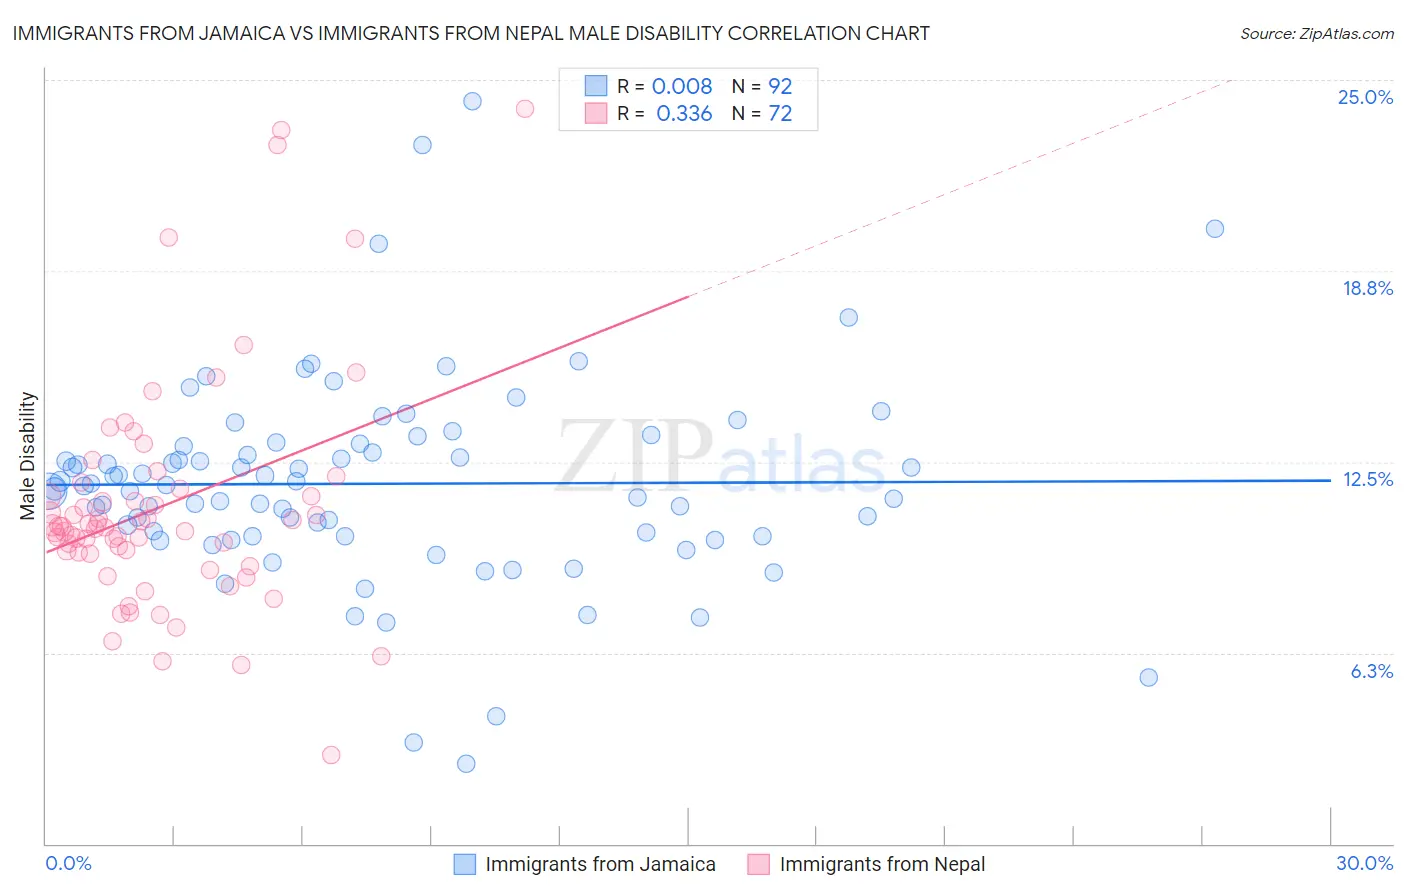
Immigrants from Jamaica vs Immigrants from Nepal Male Disability Correlation Chart
The statistical analysis conducted on geographies consisting of 301,738,521 people shows no correlation between the proportion of Immigrants from Jamaica and percentage of males with a disability in the United States with a correlation coefficient (R) of 0.008 and weighted average of 11.5%. Similarly, the statistical analysis conducted on geographies consisting of 186,783,252 people shows a mild positive correlation between the proportion of Immigrants from Nepal and percentage of males with a disability in the United States with a correlation coefficient (R) of 0.336 and weighted average of 10.3%, a difference of 11.7%.
Male Disability Correlation Summary
| Measurement | Immigrants from Jamaica | Immigrants from Nepal |
| Minimum | 2.6% | 2.9% |
| Maximum | 24.3% | 24.1% |
| Range | 21.7% | 21.2% |
| Mean | 11.8% | 11.0% |
| Median | 11.7% | 10.4% |
| Interquartile 25% (IQ1) | 10.1% | 9.5% |
| Interquartile 75% (IQ3) | 13.1% | 11.5% |
| Interquartile Range (IQR) | 3.0% | 2.0% |
| Standard Deviation (Sample) | 3.4% | 3.8% |
| Standard Deviation (Population) | 3.3% | 3.8% |
Similar Demographics by Male Disability
Demographics Similar to Immigrants from Jamaica by Male Disability
In terms of male disability, the demographic groups most similar to Immigrants from Jamaica are Lebanese (11.5%, a difference of 0.090%), Somali (11.4%, a difference of 0.18%), West Indian (11.4%, a difference of 0.20%), Immigrants from Iraq (11.5%, a difference of 0.36%), and Immigrants from Panama (11.5%, a difference of 0.36%).
| Demographics | Rating | Rank | Male Disability |
| Senegalese | 23.2 /100 | #191 | Fair 11.4% |
| Assyrians/Chaldeans/Syriacs | 23.2 /100 | #192 | Fair 11.4% |
| Greeks | 22.2 /100 | #193 | Fair 11.4% |
| Belizeans | 21.2 /100 | #194 | Fair 11.4% |
| Immigrants | Oceania | 20.9 /100 | #195 | Fair 11.4% |
| West Indians | 18.4 /100 | #196 | Poor 11.4% |
| Somalis | 18.2 /100 | #197 | Poor 11.4% |
| Immigrants | Jamaica | 16.3 /100 | #198 | Poor 11.5% |
| Lebanese | 15.4 /100 | #199 | Poor 11.5% |
| Immigrants | Iraq | 13.0 /100 | #200 | Poor 11.5% |
| Immigrants | Panama | 13.0 /100 | #201 | Poor 11.5% |
| Immigrants | Mexico | 12.6 /100 | #202 | Poor 11.5% |
| Jamaicans | 10.9 /100 | #203 | Poor 11.5% |
| Immigrants | Cambodia | 10.8 /100 | #204 | Poor 11.5% |
| Serbians | 10.7 /100 | #205 | Poor 11.5% |
Demographics Similar to Immigrants from Nepal by Male Disability
In terms of male disability, the demographic groups most similar to Immigrants from Nepal are Taiwanese (10.3%, a difference of 0.0%), Afghan (10.2%, a difference of 0.19%), Mongolian (10.3%, a difference of 0.25%), Immigrants from Bangladesh (10.3%, a difference of 0.27%), and Immigrants from Kuwait (10.2%, a difference of 0.35%).
| Demographics | Rating | Rank | Male Disability |
| Immigrants | Ethiopia | 99.9 /100 | #33 | Exceptional 10.2% |
| Immigrants | Turkey | 99.9 /100 | #34 | Exceptional 10.2% |
| Immigrants | Argentina | 99.9 /100 | #35 | Exceptional 10.2% |
| Ethiopians | 99.8 /100 | #36 | Exceptional 10.2% |
| Immigrants | Indonesia | 99.8 /100 | #37 | Exceptional 10.2% |
| Immigrants | Kuwait | 99.8 /100 | #38 | Exceptional 10.2% |
| Afghans | 99.8 /100 | #39 | Exceptional 10.2% |
| Immigrants | Nepal | 99.8 /100 | #40 | Exceptional 10.3% |
| Taiwanese | 99.8 /100 | #41 | Exceptional 10.3% |
| Mongolians | 99.7 /100 | #42 | Exceptional 10.3% |
| Immigrants | Bangladesh | 99.7 /100 | #43 | Exceptional 10.3% |
| Immigrants | El Salvador | 99.7 /100 | #44 | Exceptional 10.3% |
| Turks | 99.7 /100 | #45 | Exceptional 10.3% |
| Cambodians | 99.7 /100 | #46 | Exceptional 10.3% |
| Immigrants | Peru | 99.7 /100 | #47 | Exceptional 10.3% |