Tongan vs Immigrants from Africa Disability Age 5 to 17

COMPARE

Tongan
Race
Ancestry
AfghanAfricanAlaska NativeAlaskan AthabascanAlbanianAleutAlsatianAmericanApacheArabArapahoArgentineanArmenianAssyrian/Chaldean/SyriacAustralianAustrianBahamianBangladeshiBarbadianBasqueBelgianBelizeanBermudanBhutaneseBlackfeetBolivianBrazilianBritishBritish West IndianBulgarianBurmeseCajunCambodianCanadianCape VerdeanCarpatho RusynCelticCentral AmericanCentral American IndianCherokeeCheyenneChickasawChileanChineseChippewaChoctawColombianColvilleComancheCosta RicanCreeCreekCroatianCrowCubanCypriotCzechCzechoslovakianDanishDelawareDominicanDutchDutch West IndianEastern EuropeanEcuadorianEgyptianEnglishEstonianEthiopianEuropeanFijianFilipinoFinnishFrenchFrench American IndianFrench CanadianGermanGerman RussianGhanaianGreekGuamanian/ChamorroGuatemalanGuyaneseHaitianHmongHonduranHopiHoumaHungarianIcelanderIndian (Asian)IndonesianInupiatIranianIraqiIrishIroquoisIsraeliItalianJamaicanJapaneseJordanianKenyanKiowaKoreanLaotianLatvianLebaneseLiberianLithuanianLumbeeLuxembourgerMacedonianMalaysianMalteseMarshalleseMenomineeMexicanMexican American IndianMongolianMoroccanNative HawaiianNavajoNepaleseNew ZealanderNicaraguanNigerianNorthern EuropeanNorwegianOkinawanOsageOttawaPaiutePakistaniPalestinianPanamanianParaguayanPennsylvania GermanPeruvianPimaPolishPortuguesePotawatomiPuebloPuerto RicanPuget Sound SalishRomanianRussianSalvadoranSamoanScandinavianScotch-IrishScottishSeminoleSenegaleseSerbianShoshoneSierra LeoneanSiouxSlavicSlovakSloveneSomaliSouth AfricanSouth AmericanSouth American IndianSoviet UnionSpaniardSpanishSpanish AmericanSpanish American IndianSri LankanSubsaharan AfricanSudaneseSwedishSwissSyrianTaiwaneseThaiTlingit-HaidaTohono O'OdhamTonganTrinidadian and TobagonianTsimshianTurkishU.S. Virgin IslanderUgandanUkrainianUruguayanUteVenezuelanVietnameseWelshWest IndianYakamaYaquiYugoslavianYumanYup'ikZimbabwean
Immigration
NonimmigrantsImmigrantsAfghanistanAlbaniaArgentinaArmeniaAsiaAustraliaAustriaBahamasBangladeshBarbadosBelarusBelgiumBelizeBoliviaBosnia and HerzegovinaBrazilBulgariaBurma/MyanmarCabo VerdeCambodiaCameroonCanadaCaribbeanCentral AmericaChileChinaColombiaCongoCosta RicaCroatiaCubaCzechoslovakiaDenmarkDominicaDominican RepublicEastern AfricaEastern AsiaEastern EuropeEcuadorEgyptEl SalvadorEnglandEritreaEthiopiaEuropeFijiFranceGermanyGhanaGreeceGrenadaGuatemalaGuyanaHaitiHondurasHong KongHungaryIndiaIndonesiaIranIraqIrelandIsraelItalyJamaicaJapanJordanKazakhstanKenyaKoreaKuwaitLaosLatin AmericaLatviaLebanonLiberiaLithuaniaMalaysiaMexicoMicronesiaMiddle AfricaMoldovaMoroccoNepalNetherlandsNicaraguaNigeriaNorth AmericaNorth MacedoniaNorthern AfricaNorthern EuropeNorwayOceaniaPakistanPanamaPeruPhilippinesPolandPortugalRomaniaRussiaSaudi ArabiaScotlandSenegalSerbiaSierra LeoneSingaporeSomaliaSouth AfricaSouth AmericaSouth Central AsiaSouth Eastern AsiaSouthern EuropeSpainSri LankaSt. Vincent and the GrenadinesSudanSwedenSwitzerlandSyriaTaiwanThailandTrinidad and TobagoTurkeyUgandaUkraineUruguayUzbekistanVenezuelaVietnamWest IndiesWestern AfricaWestern AsiaWestern EuropeYemenZaireZimbabweAzores
Immigrants from Africa
Race
Ancestry
AfghanAfricanAlaska NativeAlaskan AthabascanAlbanianAleutAlsatianAmericanApacheArabArapahoArgentineanArmenianAssyrian/Chaldean/SyriacAustralianAustrianBahamianBangladeshiBarbadianBasqueBelgianBelizeanBermudanBhutaneseBlackfeetBolivianBrazilianBritishBritish West IndianBulgarianBurmeseCajunCambodianCanadianCape VerdeanCarpatho RusynCelticCentral AmericanCentral American IndianCherokeeCheyenneChickasawChileanChineseChippewaChoctawColombianColvilleComancheCosta RicanCreeCreekCroatianCrowCubanCypriotCzechCzechoslovakianDanishDelawareDominicanDutchDutch West IndianEastern EuropeanEcuadorianEgyptianEnglishEstonianEthiopianEuropeanFijianFilipinoFinnishFrenchFrench American IndianFrench CanadianGermanGerman RussianGhanaianGreekGuamanian/ChamorroGuatemalanGuyaneseHaitianHmongHonduranHopiHoumaHungarianIcelanderIndian (Asian)IndonesianInupiatIranianIraqiIrishIroquoisIsraeliItalianJamaicanJapaneseJordanianKenyanKiowaKoreanLaotianLatvianLebaneseLiberianLithuanianLumbeeLuxembourgerMacedonianMalaysianMalteseMarshalleseMenomineeMexicanMexican American IndianMongolianMoroccanNative HawaiianNavajoNepaleseNew ZealanderNicaraguanNigerianNorthern EuropeanNorwegianOkinawanOsageOttawaPaiutePakistaniPalestinianPanamanianParaguayanPennsylvania GermanPeruvianPimaPolishPortuguesePotawatomiPuebloPuerto RicanPuget Sound SalishRomanianRussianSalvadoranSamoanScandinavianScotch-IrishScottishSeminoleSenegaleseSerbianShoshoneSierra LeoneanSiouxSlavicSlovakSloveneSomaliSouth AfricanSouth AmericanSouth American IndianSoviet UnionSpaniardSpanishSpanish AmericanSpanish American IndianSri LankanSubsaharan AfricanSudaneseSwedishSwissSyrianTaiwaneseThaiTlingit-HaidaTohono O'OdhamTrinidadian and TobagonianTsimshianTurkishU.S. Virgin IslanderUgandanUkrainianUruguayanUteVenezuelanVietnameseWelshWest IndianYakamaYaquiYugoslavianYumanYup'ikZimbabwean
Immigration
NonimmigrantsImmigrantsAfghanistanAfricaAlbaniaArgentinaArmeniaAsiaAustraliaAustriaBahamasBangladeshBarbadosBelarusBelgiumBelizeBoliviaBosnia and HerzegovinaBrazilBulgariaBurma/MyanmarCabo VerdeCambodiaCameroonCanadaCaribbeanCentral AmericaChileChinaColombiaCongoCosta RicaCroatiaCubaCzechoslovakiaDenmarkDominicaDominican RepublicEastern AfricaEastern AsiaEastern EuropeEcuadorEgyptEl SalvadorEnglandEritreaEthiopiaEuropeFijiFranceGermanyGhanaGreeceGrenadaGuatemalaGuyanaHaitiHondurasHong KongHungaryIndiaIndonesiaIranIraqIrelandIsraelItalyJamaicaJapanJordanKazakhstanKenyaKoreaKuwaitLaosLatin AmericaLatviaLebanonLiberiaLithuaniaMalaysiaMexicoMicronesiaMiddle AfricaMoldovaMoroccoNepalNetherlandsNicaraguaNigeriaNorth AmericaNorth MacedoniaNorthern AfricaNorthern EuropeNorwayOceaniaPakistanPanamaPeruPhilippinesPolandPortugalRomaniaRussiaSaudi ArabiaScotlandSenegalSerbiaSierra LeoneSingaporeSomaliaSouth AfricaSouth AmericaSouth Central AsiaSouth Eastern AsiaSouthern EuropeSpainSri LankaSt. Vincent and the GrenadinesSudanSwedenSwitzerlandSyriaTaiwanThailandTrinidad and TobagoTurkeyUgandaUkraineUruguayUzbekistanVenezuelaVietnamWest IndiesWestern AfricaWestern AsiaWestern EuropeYemenZaireZimbabweAzores
Disability Age 5 to 17
Income
Poverty
Unemployment
Labor Participation
Family Structure
Vehicle Availability
Education Level
Disability

Disability Age 5 to 17 Comparison

Tongans

Immigrants from Africa

Exceptional
Poor
5.0%
DISABILITY AGE 5 TO 17
100.0/ 100
METRIC RATING
45th/ 347
METRIC RANK
5.7%
DISABILITY AGE 5 TO 17
10.8/ 100
METRIC RATING
206th/ 347
METRIC RANK

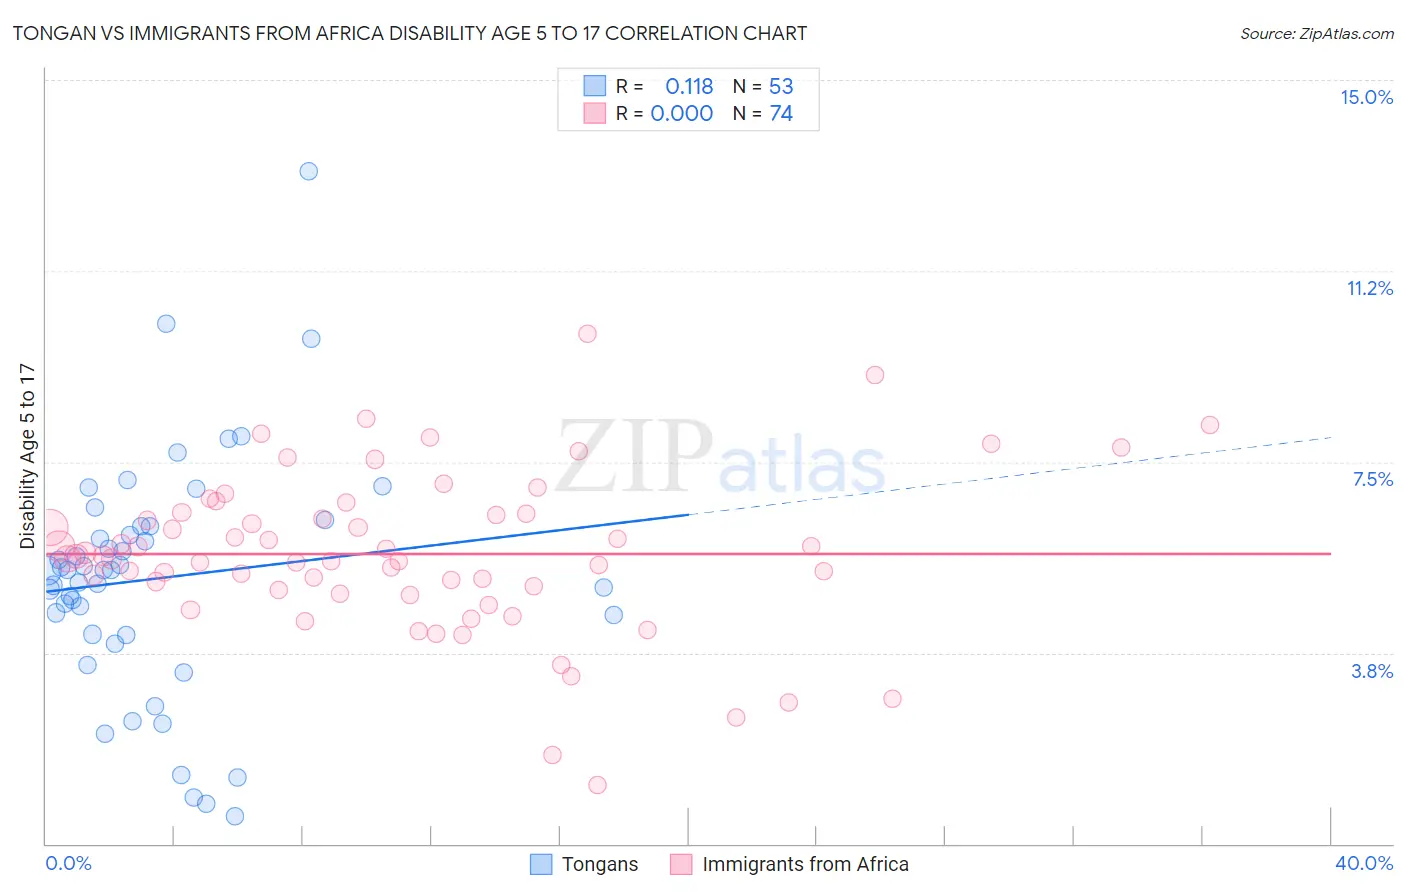
Tongan vs Immigrants from Africa Disability Age 5 to 17 Correlation Chart

The statistical analysis conducted on geographies consisting of 102,679,280 people shows a poor positive correlation between the proportion of Tongans and percentage of population with a disability between the ages 5 and 17 in the United States with a correlation coefficient (R) of 0.118 and weighted average of 5.0%. Similarly, the statistical analysis conducted on geographies consisting of 464,573,115 people shows no correlation between the proportion of Immigrants from Africa and percentage of population with a disability between the ages 5 and 17 in the United States with a correlation coefficient (R) of 0.000 and weighted average of 5.7%, a difference of 14.0%.
Tongan vs Immigrants from Africa Disability Age 5 to 17

Disability Age 5 to 17 Correlation Summary

MeasurementTonganImmigrants from Africa
Minimum0.54%1.2%
Maximum13.2%10.0%
Range12.7%8.9%
Mean5.2%5.7%
Median5.4%5.6%
Interquartile 25% (IQ1)4.1%5.0%
Interquartile 75% (IQ3)6.2%6.5%
Interquartile Range (IQR)2.1%1.5%
Standard Deviation (Sample)2.4%1.6%
Standard Deviation (Population)2.3%1.6%

Similar Demographics by Disability Age 5 to 17

Demographics Similar to Tongans by Disability Age 5 to 17

In terms of disability age 5 to 17, the demographic groups most similar to Tongans are Egyptian (5.0%, a difference of 0.070%), Assyrian/Chaldean/Syriac (5.0%, a difference of 0.070%), Immigrants from Russia (5.0%, a difference of 0.11%), Vietnamese (5.1%, a difference of 0.19%), and Korean (5.1%, a difference of 0.38%).
DemographicsRating | RankDisability Age 5 to 17
Immigrants | Philippines
100.0
/100
|
#38
Exceptional
5.0%
Immigrants | Argentina
100.0
/100
|
#39
Exceptional
5.0%
Okinawans
100.0
/100
|
#40
Exceptional
5.0%
Immigrants | Australia
100.0
/100
|
#41
Exceptional
5.0%
Immigrants | Sri Lanka
100.0
/100
|
#42
Exceptional
5.0%
Immigrants | Russia
100.0
/100
|
#43
Exceptional
5.0%
Egyptians
100.0
/100
|
#44
Exceptional
5.0%
Tongans
100.0
/100
|
#45
Exceptional
5.0%
Assyrians/Chaldeans/Syriacs
100.0
/100
|
#46
Exceptional
5.0%
Vietnamese
100.0
/100
|
#47
Exceptional
5.1%
Koreans
100.0
/100
|
#48
Exceptional
5.1%
Immigrants | Western Asia
100.0
/100
|
#49
Exceptional
5.1%
Argentineans
99.9
/100
|
#50
Exceptional
5.1%
Turks
99.9
/100
|
#51
Exceptional
5.1%
Immigrants | Fiji
99.9
/100
|
#52
Exceptional
5.1%

Demographics Similar to Immigrants from Africa by Disability Age 5 to 17

In terms of disability age 5 to 17, the demographic groups most similar to Immigrants from Africa are Trinidadian and Tobagonian (5.7%, a difference of 0.0%), Moroccan (5.7%, a difference of 0.050%), Paiute (5.7%, a difference of 0.060%), Kenyan (5.8%, a difference of 0.10%), and Immigrants from Uganda (5.8%, a difference of 0.14%).
DemographicsRating | RankDisability Age 5 to 17
Northern Europeans
15.2
/100
|
#199
Poor
5.7%
Icelanders
14.6
/100
|
#200
Poor
5.7%
Basques
13.7
/100
|
#201
Poor
5.7%
Austrians
13.2
/100
|
#202
Poor
5.7%
Spanish American Indians
12.8
/100
|
#203
Poor
5.7%
Paiute
11.2
/100
|
#204
Poor
5.7%
Trinidadians and Tobagonians
10.8
/100
|
#205
Poor
5.7%
Immigrants | Africa
10.8
/100
|
#206
Poor
5.7%
Moroccans
10.4
/100
|
#207
Poor
5.7%
Kenyans
10.0
/100
|
#208
Poor
5.8%
Immigrants | Uganda
9.7
/100
|
#209
Tragic
5.8%
Immigrants | Haiti
9.5
/100
|
#210
Tragic
5.8%
Yugoslavians
9.1
/100
|
#211
Tragic
5.8%
Immigrants | Panama
8.7
/100
|
#212
Tragic
5.8%
Immigrants | Cameroon
8.3
/100
|
#213
Tragic
5.8%