Tongan vs Immigrants from Bolivia Disability Age 5 to 17
COMPARE
Tongan
Immigrants from Bolivia
Disability Age 5 to 17
Disability Age 5 to 17 Comparison
Tongans
Immigrants from Bolivia
5.0%
DISABILITY AGE 5 TO 17
100.0/ 100
METRIC RATING
45th/ 347
METRIC RANK
4.8%
DISABILITY AGE 5 TO 17
100.0/ 100
METRIC RATING
23rd/ 347
METRIC RANK
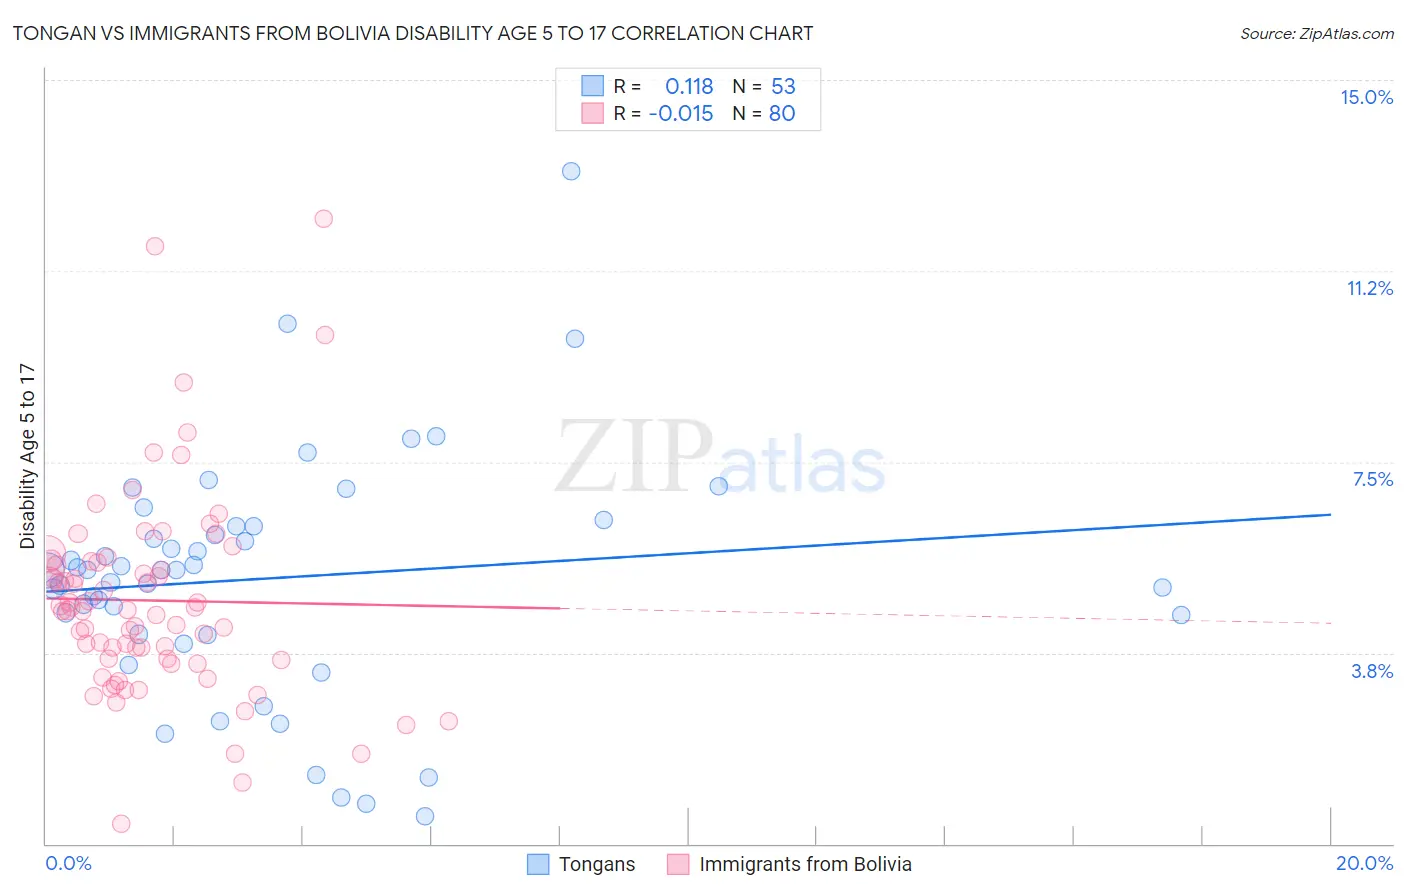
Tongan vs Immigrants from Bolivia Disability Age 5 to 17 Correlation Chart
The statistical analysis conducted on geographies consisting of 102,679,280 people shows a poor positive correlation between the proportion of Tongans and percentage of population with a disability between the ages 5 and 17 in the United States with a correlation coefficient (R) of 0.118 and weighted average of 5.0%. Similarly, the statistical analysis conducted on geographies consisting of 158,284,084 people shows no correlation between the proportion of Immigrants from Bolivia and percentage of population with a disability between the ages 5 and 17 in the United States with a correlation coefficient (R) of -0.015 and weighted average of 4.8%, a difference of 4.2%.
Disability Age 5 to 17 Correlation Summary
| Measurement | Tongan | Immigrants from Bolivia |
| Minimum | 0.54% | 0.40% |
| Maximum | 13.2% | 12.3% |
| Range | 12.7% | 11.9% |
| Mean | 5.2% | 4.8% |
| Median | 5.4% | 4.6% |
| Interquartile 25% (IQ1) | 4.1% | 3.6% |
| Interquartile 75% (IQ3) | 6.2% | 5.5% |
| Interquartile Range (IQR) | 2.1% | 1.9% |
| Standard Deviation (Sample) | 2.4% | 2.0% |
| Standard Deviation (Population) | 2.3% | 2.0% |
Similar Demographics by Disability Age 5 to 17
Demographics Similar to Tongans by Disability Age 5 to 17
In terms of disability age 5 to 17, the demographic groups most similar to Tongans are Egyptian (5.0%, a difference of 0.070%), Assyrian/Chaldean/Syriac (5.0%, a difference of 0.070%), Immigrants from Russia (5.0%, a difference of 0.11%), Vietnamese (5.1%, a difference of 0.19%), and Korean (5.1%, a difference of 0.38%).
| Demographics | Rating | Rank | Disability Age 5 to 17 |
| Immigrants | Philippines | 100.0 /100 | #38 | Exceptional 5.0% |
| Immigrants | Argentina | 100.0 /100 | #39 | Exceptional 5.0% |
| Okinawans | 100.0 /100 | #40 | Exceptional 5.0% |
| Immigrants | Australia | 100.0 /100 | #41 | Exceptional 5.0% |
| Immigrants | Sri Lanka | 100.0 /100 | #42 | Exceptional 5.0% |
| Immigrants | Russia | 100.0 /100 | #43 | Exceptional 5.0% |
| Egyptians | 100.0 /100 | #44 | Exceptional 5.0% |
| Tongans | 100.0 /100 | #45 | Exceptional 5.0% |
| Assyrians/Chaldeans/Syriacs | 100.0 /100 | #46 | Exceptional 5.0% |
| Vietnamese | 100.0 /100 | #47 | Exceptional 5.1% |
| Koreans | 100.0 /100 | #48 | Exceptional 5.1% |
| Immigrants | Western Asia | 100.0 /100 | #49 | Exceptional 5.1% |
| Argentineans | 99.9 /100 | #50 | Exceptional 5.1% |
| Turks | 99.9 /100 | #51 | Exceptional 5.1% |
| Immigrants | Fiji | 99.9 /100 | #52 | Exceptional 5.1% |
Demographics Similar to Immigrants from Bolivia by Disability Age 5 to 17
In terms of disability age 5 to 17, the demographic groups most similar to Immigrants from Bolivia are Immigrants from Lebanon (4.8%, a difference of 0.15%), Immigrants from Asia (4.8%, a difference of 0.26%), Asian (4.8%, a difference of 0.66%), Yup'ik (4.8%, a difference of 1.0%), and Bhutanese (4.9%, a difference of 1.1%).
| Demographics | Rating | Rank | Disability Age 5 to 17 |
| Immigrants | Singapore | 100.0 /100 | #16 | Exceptional 4.7% |
| Arapaho | 100.0 /100 | #17 | Exceptional 4.7% |
| Immigrants | South Central Asia | 100.0 /100 | #18 | Exceptional 4.7% |
| Immigrants | Uzbekistan | 100.0 /100 | #19 | Exceptional 4.8% |
| Burmese | 100.0 /100 | #20 | Exceptional 4.8% |
| Yup'ik | 100.0 /100 | #21 | Exceptional 4.8% |
| Asians | 100.0 /100 | #22 | Exceptional 4.8% |
| Immigrants | Bolivia | 100.0 /100 | #23 | Exceptional 4.8% |
| Immigrants | Lebanon | 100.0 /100 | #24 | Exceptional 4.8% |
| Immigrants | Asia | 100.0 /100 | #25 | Exceptional 4.8% |
| Bhutanese | 100.0 /100 | #26 | Exceptional 4.9% |
| Taiwanese | 100.0 /100 | #27 | Exceptional 4.9% |
| Immigrants | Japan | 100.0 /100 | #28 | Exceptional 4.9% |
| Immigrants | Serbia | 100.0 /100 | #29 | Exceptional 4.9% |
| Immigrants | Malaysia | 100.0 /100 | #30 | Exceptional 5.0% |