Tongan vs Immigrants from Africa Single Father Households
COMPARE
Tongan
Immigrants from Africa
Single Father Households
Single Father Households Comparison
Tongans
Immigrants from Africa
2.5%
SINGLE FATHER HOUSEHOLDS
1.5/ 100
METRIC RATING
255th/ 347
METRIC RANK
2.4%
SINGLE FATHER HOUSEHOLDS
30.0/ 100
METRIC RATING
191st/ 347
METRIC RANK
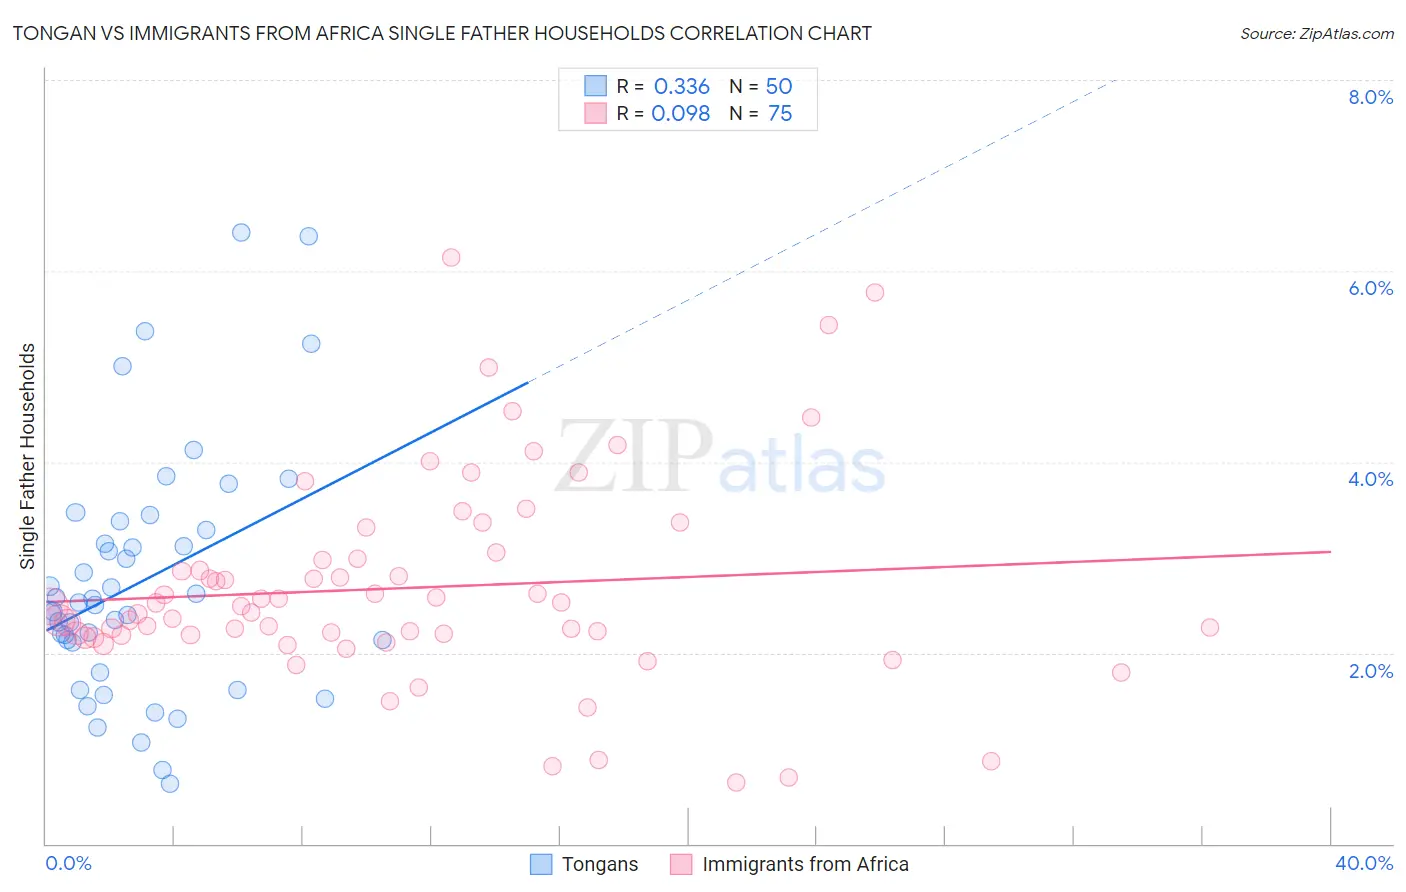
Tongan vs Immigrants from Africa Single Father Households Correlation Chart
The statistical analysis conducted on geographies consisting of 102,674,538 people shows a mild positive correlation between the proportion of Tongans and percentage of single father households in the United States with a correlation coefficient (R) of 0.336 and weighted average of 2.5%. Similarly, the statistical analysis conducted on geographies consisting of 464,041,277 people shows a slight positive correlation between the proportion of Immigrants from Africa and percentage of single father households in the United States with a correlation coefficient (R) of 0.098 and weighted average of 2.4%, a difference of 6.1%.
Single Father Households Correlation Summary
| Measurement | Tongan | Immigrants from Africa |
| Minimum | 0.63% | 0.64% |
| Maximum | 6.4% | 6.1% |
| Range | 5.8% | 5.5% |
| Mean | 2.7% | 2.7% |
| Median | 2.5% | 2.5% |
| Interquartile 25% (IQ1) | 2.1% | 2.2% |
| Interquartile 75% (IQ3) | 3.3% | 3.0% |
| Interquartile Range (IQR) | 1.2% | 0.81% |
| Standard Deviation (Sample) | 1.3% | 1.1% |
| Standard Deviation (Population) | 1.3% | 1.1% |
Similar Demographics by Single Father Households
Demographics Similar to Tongans by Single Father Households
In terms of single father households, the demographic groups most similar to Tongans are Potawatomi (2.5%, a difference of 0.060%), Immigrants from Congo (2.5%, a difference of 0.34%), Immigrants from Thailand (2.5%, a difference of 0.41%), Spanish (2.5%, a difference of 0.43%), and Immigrants from Somalia (2.5%, a difference of 0.45%).
| Demographics | Rating | Rank | Single Father Households |
| Bahamians | 2.4 /100 | #248 | Tragic 2.5% |
| Immigrants | Cameroon | 2.3 /100 | #249 | Tragic 2.5% |
| Somalis | 2.1 /100 | #250 | Tragic 2.5% |
| Liberians | 2.0 /100 | #251 | Tragic 2.5% |
| Immigrants | Eritrea | 2.0 /100 | #252 | Tragic 2.5% |
| Immigrants | Somalia | 1.9 /100 | #253 | Tragic 2.5% |
| Immigrants | Thailand | 1.8 /100 | #254 | Tragic 2.5% |
| Tongans | 1.5 /100 | #255 | Tragic 2.5% |
| Potawatomi | 1.4 /100 | #256 | Tragic 2.5% |
| Immigrants | Congo | 1.2 /100 | #257 | Tragic 2.5% |
| Spanish | 1.1 /100 | #258 | Tragic 2.5% |
| Comanche | 1.0 /100 | #259 | Tragic 2.5% |
| Immigrants | Caribbean | 1.0 /100 | #260 | Tragic 2.5% |
| Immigrants | Belize | 0.9 /100 | #261 | Tragic 2.5% |
| Immigrants | Liberia | 0.8 /100 | #262 | Tragic 2.5% |
Demographics Similar to Immigrants from Africa by Single Father Households
In terms of single father households, the demographic groups most similar to Immigrants from Africa are Immigrants from Sudan (2.4%, a difference of 0.010%), Uruguayan (2.4%, a difference of 0.030%), Panamanian (2.4%, a difference of 0.030%), Immigrants from Philippines (2.4%, a difference of 0.11%), and U.S. Virgin Islander (2.4%, a difference of 0.15%).
| Demographics | Rating | Rank | Single Father Households |
| Sri Lankans | 41.8 /100 | #184 | Average 2.4% |
| Nigerians | 41.0 /100 | #185 | Average 2.4% |
| Immigrants | Bosnia and Herzegovina | 40.4 /100 | #186 | Average 2.4% |
| Immigrants | Colombia | 34.0 /100 | #187 | Fair 2.4% |
| Hmong | 33.0 /100 | #188 | Fair 2.4% |
| U.S. Virgin Islanders | 31.8 /100 | #189 | Fair 2.4% |
| French | 31.7 /100 | #190 | Fair 2.4% |
| Immigrants | Africa | 30.0 /100 | #191 | Fair 2.4% |
| Immigrants | Sudan | 29.8 /100 | #192 | Fair 2.4% |
| Uruguayans | 29.7 /100 | #193 | Fair 2.4% |
| Panamanians | 29.6 /100 | #194 | Fair 2.4% |
| Immigrants | Philippines | 28.7 /100 | #195 | Fair 2.4% |
| Kenyans | 28.0 /100 | #196 | Fair 2.4% |
| Germans | 28.0 /100 | #197 | Fair 2.4% |
| Scandinavians | 27.4 /100 | #198 | Fair 2.4% |