Tongan vs Dominican Hearing Disability
COMPARE
Tongan
Dominican
Hearing Disability
Hearing Disability Comparison
Tongans
Dominicans
2.9%
HEARING DISABILITY
78.6/ 100
METRIC RATING
147th/ 347
METRIC RANK
2.5%
HEARING DISABILITY
99.8/ 100
METRIC RATING
18th/ 347
METRIC RANK
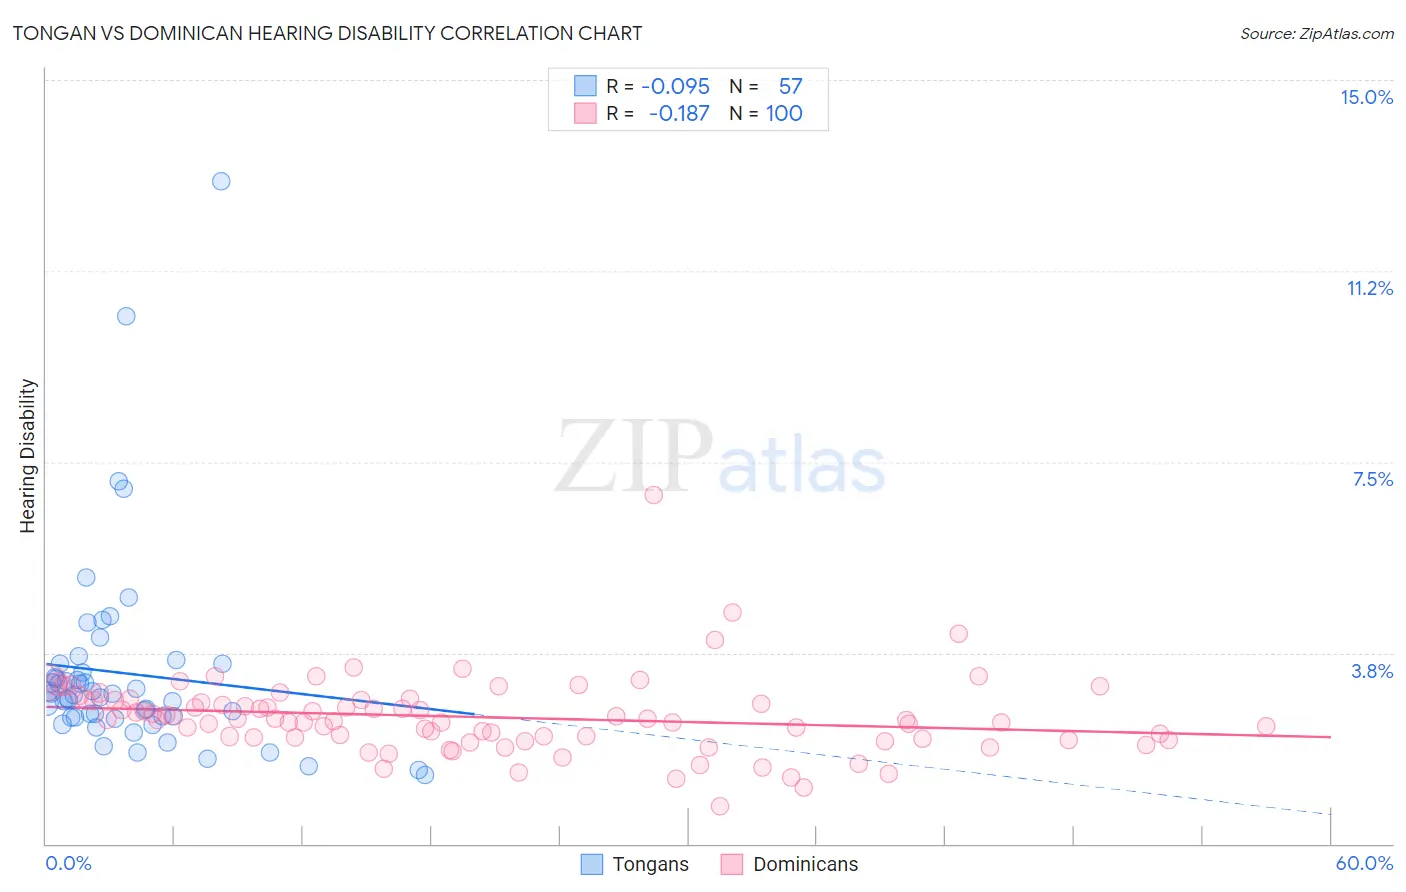
Tongan vs Dominican Hearing Disability Correlation Chart
The statistical analysis conducted on geographies consisting of 102,876,442 people shows a slight negative correlation between the proportion of Tongans and percentage of population with hearing disability in the United States with a correlation coefficient (R) of -0.095 and weighted average of 2.9%. Similarly, the statistical analysis conducted on geographies consisting of 354,884,530 people shows a poor negative correlation between the proportion of Dominicans and percentage of population with hearing disability in the United States with a correlation coefficient (R) of -0.187 and weighted average of 2.5%, a difference of 14.0%.
Hearing Disability Correlation Summary
| Measurement | Tongan | Dominican |
| Minimum | 1.4% | 0.73% |
| Maximum | 13.0% | 6.8% |
| Range | 11.7% | 6.1% |
| Mean | 3.3% | 2.5% |
| Median | 2.9% | 2.4% |
| Interquartile 25% (IQ1) | 2.5% | 2.1% |
| Interquartile 75% (IQ3) | 3.4% | 2.8% |
| Interquartile Range (IQR) | 0.97% | 0.74% |
| Standard Deviation (Sample) | 2.0% | 0.77% |
| Standard Deviation (Population) | 1.9% | 0.76% |
Similar Demographics by Hearing Disability
Demographics Similar to Tongans by Hearing Disability
In terms of hearing disability, the demographic groups most similar to Tongans are Brazilian (2.9%, a difference of 0.010%), Immigrants from Congo (2.9%, a difference of 0.030%), Immigrants from Bulgaria (2.9%, a difference of 0.080%), Immigrants from Russia (2.9%, a difference of 0.13%), and Immigrants from Panama (2.9%, a difference of 0.25%).
| Demographics | Rating | Rank | Hearing Disability |
| Immigrants | Jordan | 83.7 /100 | #140 | Excellent 2.9% |
| Sub-Saharan Africans | 83.3 /100 | #141 | Excellent 2.9% |
| Laotians | 81.1 /100 | #142 | Excellent 2.9% |
| Immigrants | Bahamas | 80.9 /100 | #143 | Excellent 2.9% |
| Immigrants | Bulgaria | 79.2 /100 | #144 | Good 2.9% |
| Immigrants | Congo | 78.9 /100 | #145 | Good 2.9% |
| Brazilians | 78.7 /100 | #146 | Good 2.9% |
| Tongans | 78.6 /100 | #147 | Good 2.9% |
| Immigrants | Russia | 77.7 /100 | #148 | Good 2.9% |
| Immigrants | Panama | 76.9 /100 | #149 | Good 2.9% |
| Palestinians | 73.6 /100 | #150 | Good 2.9% |
| Immigrants | France | 73.1 /100 | #151 | Good 2.9% |
| Immigrants | Lithuania | 73.0 /100 | #152 | Good 2.9% |
| Sudanese | 72.1 /100 | #153 | Good 2.9% |
| Immigrants | Lebanon | 71.5 /100 | #154 | Good 2.9% |
Demographics Similar to Dominicans by Hearing Disability
In terms of hearing disability, the demographic groups most similar to Dominicans are Thai (2.5%, a difference of 0.030%), Immigrants from Bolivia (2.5%, a difference of 0.070%), Ghanaian (2.5%, a difference of 0.14%), Immigrants from Sierra Leone (2.6%, a difference of 0.18%), and Immigrants from Nigeria (2.6%, a difference of 0.68%).
| Demographics | Rating | Rank | Hearing Disability |
| Immigrants | Trinidad and Tobago | 99.9 /100 | #11 | Exceptional 2.5% |
| Trinidadians and Tobagonians | 99.9 /100 | #12 | Exceptional 2.5% |
| Sierra Leoneans | 99.9 /100 | #13 | Exceptional 2.5% |
| Ecuadorians | 99.9 /100 | #14 | Exceptional 2.5% |
| Barbadians | 99.9 /100 | #15 | Exceptional 2.5% |
| Immigrants | West Indies | 99.9 /100 | #16 | Exceptional 2.5% |
| Immigrants | India | 99.9 /100 | #17 | Exceptional 2.5% |
| Dominicans | 99.8 /100 | #18 | Exceptional 2.5% |
| Thais | 99.8 /100 | #19 | Exceptional 2.5% |
| Immigrants | Bolivia | 99.8 /100 | #20 | Exceptional 2.5% |
| Ghanaians | 99.8 /100 | #21 | Exceptional 2.5% |
| Immigrants | Sierra Leone | 99.8 /100 | #22 | Exceptional 2.6% |
| Immigrants | Nigeria | 99.8 /100 | #23 | Exceptional 2.6% |
| Immigrants | Ghana | 99.8 /100 | #24 | Exceptional 2.6% |
| Immigrants | El Salvador | 99.7 /100 | #25 | Exceptional 2.6% |