Tongan vs Israeli Hearing Disability
COMPARE
Tongan
Israeli
Hearing Disability
Hearing Disability Comparison
Tongans
Israelis
2.9%
HEARING DISABILITY
78.6/ 100
METRIC RATING
147th/ 347
METRIC RANK
2.8%
HEARING DISABILITY
95.9/ 100
METRIC RATING
95th/ 347
METRIC RANK
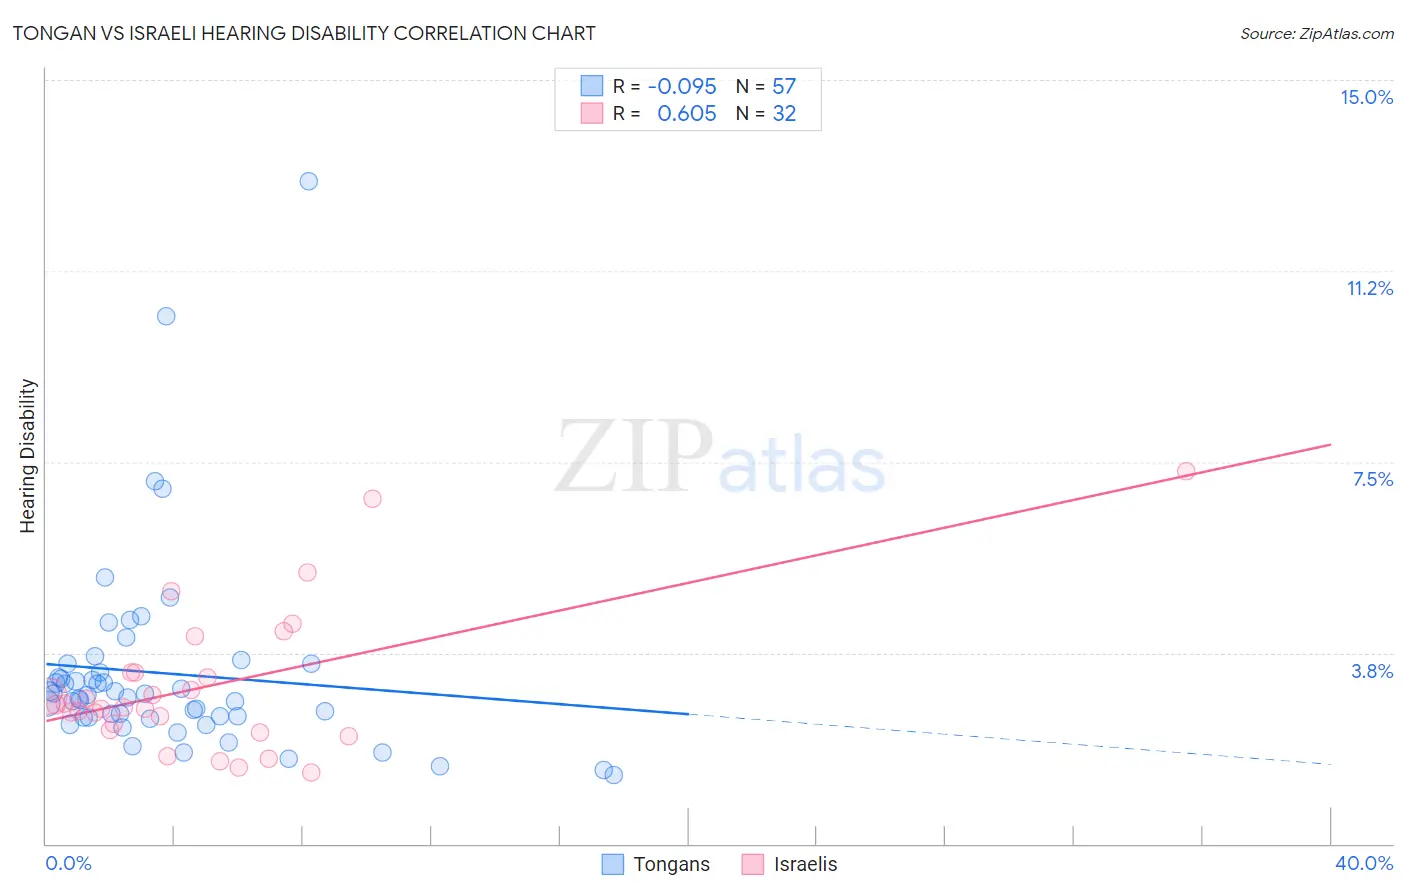
Tongan vs Israeli Hearing Disability Correlation Chart
The statistical analysis conducted on geographies consisting of 102,876,442 people shows a slight negative correlation between the proportion of Tongans and percentage of population with hearing disability in the United States with a correlation coefficient (R) of -0.095 and weighted average of 2.9%. Similarly, the statistical analysis conducted on geographies consisting of 211,123,306 people shows a significant positive correlation between the proportion of Israelis and percentage of population with hearing disability in the United States with a correlation coefficient (R) of 0.605 and weighted average of 2.8%, a difference of 4.7%.
Hearing Disability Correlation Summary
| Measurement | Tongan | Israeli |
| Minimum | 1.4% | 1.4% |
| Maximum | 13.0% | 7.3% |
| Range | 11.7% | 5.9% |
| Mean | 3.3% | 3.1% |
| Median | 2.9% | 2.7% |
| Interquartile 25% (IQ1) | 2.5% | 2.3% |
| Interquartile 75% (IQ3) | 3.4% | 3.4% |
| Interquartile Range (IQR) | 0.97% | 1.1% |
| Standard Deviation (Sample) | 2.0% | 1.4% |
| Standard Deviation (Population) | 1.9% | 1.4% |
Similar Demographics by Hearing Disability
Demographics Similar to Tongans by Hearing Disability
In terms of hearing disability, the demographic groups most similar to Tongans are Brazilian (2.9%, a difference of 0.010%), Immigrants from Congo (2.9%, a difference of 0.030%), Immigrants from Bulgaria (2.9%, a difference of 0.080%), Immigrants from Russia (2.9%, a difference of 0.13%), and Immigrants from Panama (2.9%, a difference of 0.25%).
| Demographics | Rating | Rank | Hearing Disability |
| Immigrants | Jordan | 83.7 /100 | #140 | Excellent 2.9% |
| Sub-Saharan Africans | 83.3 /100 | #141 | Excellent 2.9% |
| Laotians | 81.1 /100 | #142 | Excellent 2.9% |
| Immigrants | Bahamas | 80.9 /100 | #143 | Excellent 2.9% |
| Immigrants | Bulgaria | 79.2 /100 | #144 | Good 2.9% |
| Immigrants | Congo | 78.9 /100 | #145 | Good 2.9% |
| Brazilians | 78.7 /100 | #146 | Good 2.9% |
| Tongans | 78.6 /100 | #147 | Good 2.9% |
| Immigrants | Russia | 77.7 /100 | #148 | Good 2.9% |
| Immigrants | Panama | 76.9 /100 | #149 | Good 2.9% |
| Palestinians | 73.6 /100 | #150 | Good 2.9% |
| Immigrants | France | 73.1 /100 | #151 | Good 2.9% |
| Immigrants | Lithuania | 73.0 /100 | #152 | Good 2.9% |
| Sudanese | 72.1 /100 | #153 | Good 2.9% |
| Immigrants | Lebanon | 71.5 /100 | #154 | Good 2.9% |
Demographics Similar to Israelis by Hearing Disability
In terms of hearing disability, the demographic groups most similar to Israelis are Uruguayan (2.8%, a difference of 0.020%), Immigrants from Somalia (2.8%, a difference of 0.19%), Immigrants from Kuwait (2.8%, a difference of 0.29%), Immigrants from Afghanistan (2.8%, a difference of 0.36%), and Iranian (2.8%, a difference of 0.41%).
| Demographics | Rating | Rank | Hearing Disability |
| Immigrants | Turkey | 96.7 /100 | #88 | Exceptional 2.8% |
| Belizeans | 96.6 /100 | #89 | Exceptional 2.8% |
| Immigrants | Morocco | 96.6 /100 | #90 | Exceptional 2.8% |
| Immigrants | Middle Africa | 96.5 /100 | #91 | Exceptional 2.8% |
| Iranians | 96.4 /100 | #92 | Exceptional 2.8% |
| Immigrants | Kuwait | 96.3 /100 | #93 | Exceptional 2.8% |
| Uruguayans | 95.9 /100 | #94 | Exceptional 2.8% |
| Israelis | 95.9 /100 | #95 | Exceptional 2.8% |
| Immigrants | Somalia | 95.5 /100 | #96 | Exceptional 2.8% |
| Immigrants | Afghanistan | 95.3 /100 | #97 | Exceptional 2.8% |
| Immigrants | Honduras | 95.1 /100 | #98 | Exceptional 2.8% |
| Immigrants | Guatemala | 95.1 /100 | #99 | Exceptional 2.8% |
| Immigrants | Eastern Africa | 95.0 /100 | #100 | Exceptional 2.8% |
| Immigrants | Spain | 94.9 /100 | #101 | Exceptional 2.8% |
| Taiwanese | 94.8 /100 | #102 | Exceptional 2.8% |